Fig. 11.
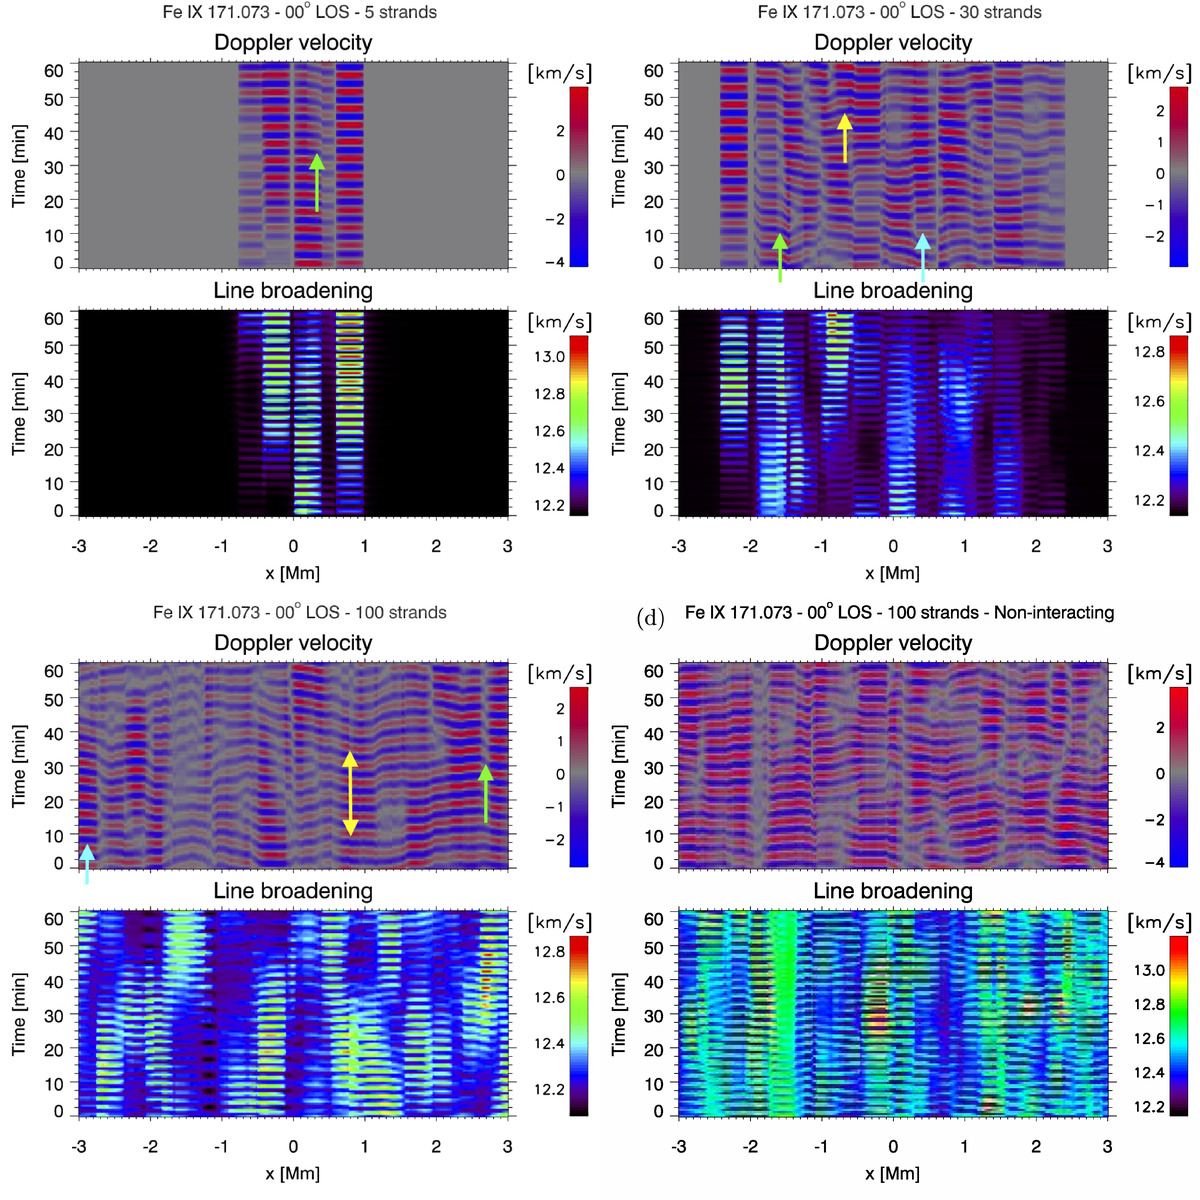
Synthetic images for Ns = 100 strands from the FoMo code for (a) 5 strands, (b) 30 strands and (c) 100 strands cases. In (d) the case of 100 non-interacting strands is plotted (see text). Each panel shows time distances of the Doppler and line-broadening velocities. The arrows indicate some examples discussed in the text of regions with constructive (light blue), destructive (green), or amplified Doppler and line-broadening signals (yellow).
Current usage metrics show cumulative count of Article Views (full-text article views including HTML views, PDF and ePub downloads, according to the available data) and Abstracts Views on Vision4Press platform.
Data correspond to usage on the plateform after 2015. The current usage metrics is available 48-96 hours after online publication and is updated daily on week days.
Initial download of the metrics may take a while.