Fig. 4.
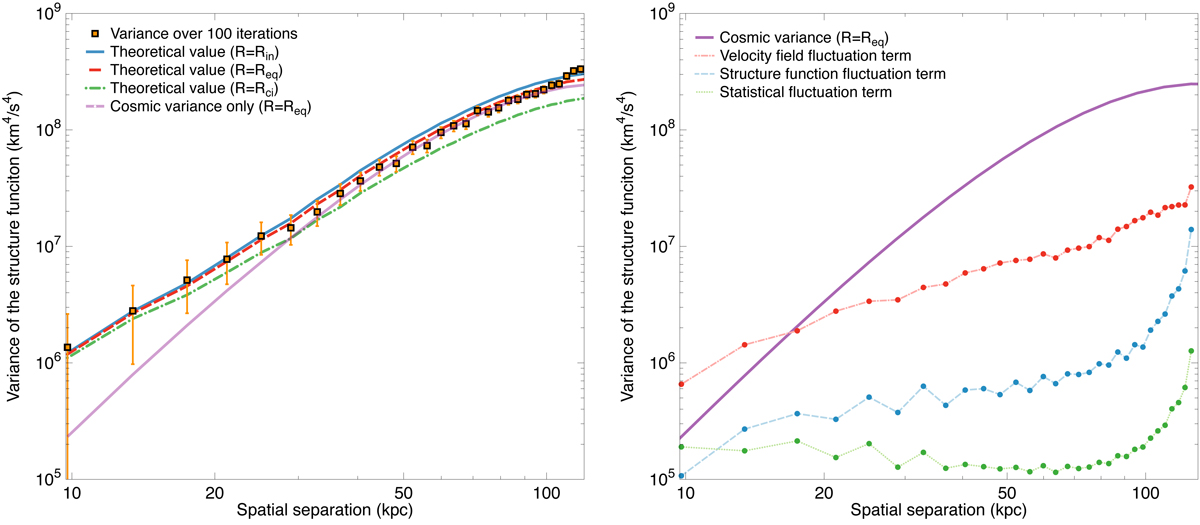
Left: structure function variance (km4 s−4) averaged over 100 observations of a velocity field generated with the same underlying turbulent power spectrum (kinj = 1/200 kpc−1, kdis = 1/20 kpc−1) and corresponding ±1σ error bars as a function of the separation s (kpc). The comparison to the theoretical models derived from the simulation and the formulas by CL19 is shown for a circular FoV of Rin (blue solid), Req (red dashed) or Rci (green dash-dotted). The sheer contribution of the cosmic variance without statistical terms for R = Req is given in light purple. Right: error contributions in the total variance for the previous case for R = Req when σstat, C = 34 km s−1. The data points for the statistical and structure function fluctuation term are derived from analytical formulas, while the velocity field fluctuation term is computed using the 100 iterations (see text).
Current usage metrics show cumulative count of Article Views (full-text article views including HTML views, PDF and ePub downloads, according to the available data) and Abstracts Views on Vision4Press platform.
Data correspond to usage on the plateform after 2015. The current usage metrics is available 48-96 hours after online publication and is updated daily on week days.
Initial download of the metrics may take a while.