Fig. 8.
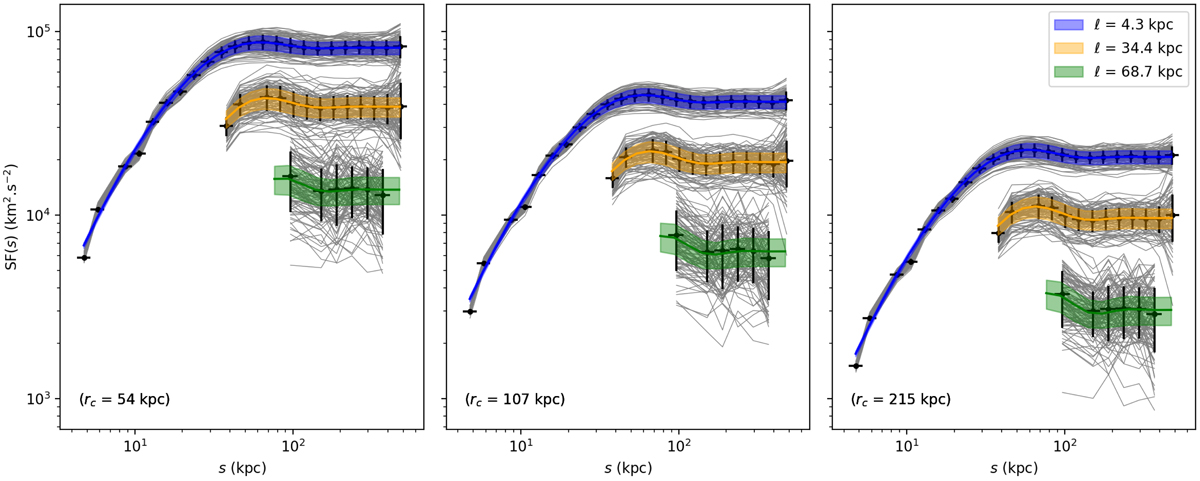
Comparison of numerical and analytical structure functions and their sample variance for various cluster sizes (i.e. various core radii (rc) of the β-model) and various pixel sizes (ℓ). The data points and thick error bars show the sample mean and standard deviation of the 100 realisations (individually represented as thin grey lines) for each of the considered configurations. The coloured curves and shaded areas represent the analytical calculations following Eqs. (12) and (13). The emissivity model is Xbeta and the region of analysis is a circle of diameter 520 kpc (as displayed in Fig. E.1). The turbulent power spectrum is that of Table 1 with an injection scale of 100 kpc.
Current usage metrics show cumulative count of Article Views (full-text article views including HTML views, PDF and ePub downloads, according to the available data) and Abstracts Views on Vision4Press platform.
Data correspond to usage on the plateform after 2015. The current usage metrics is available 48-96 hours after online publication and is updated daily on week days.
Initial download of the metrics may take a while.