Fig. 7.
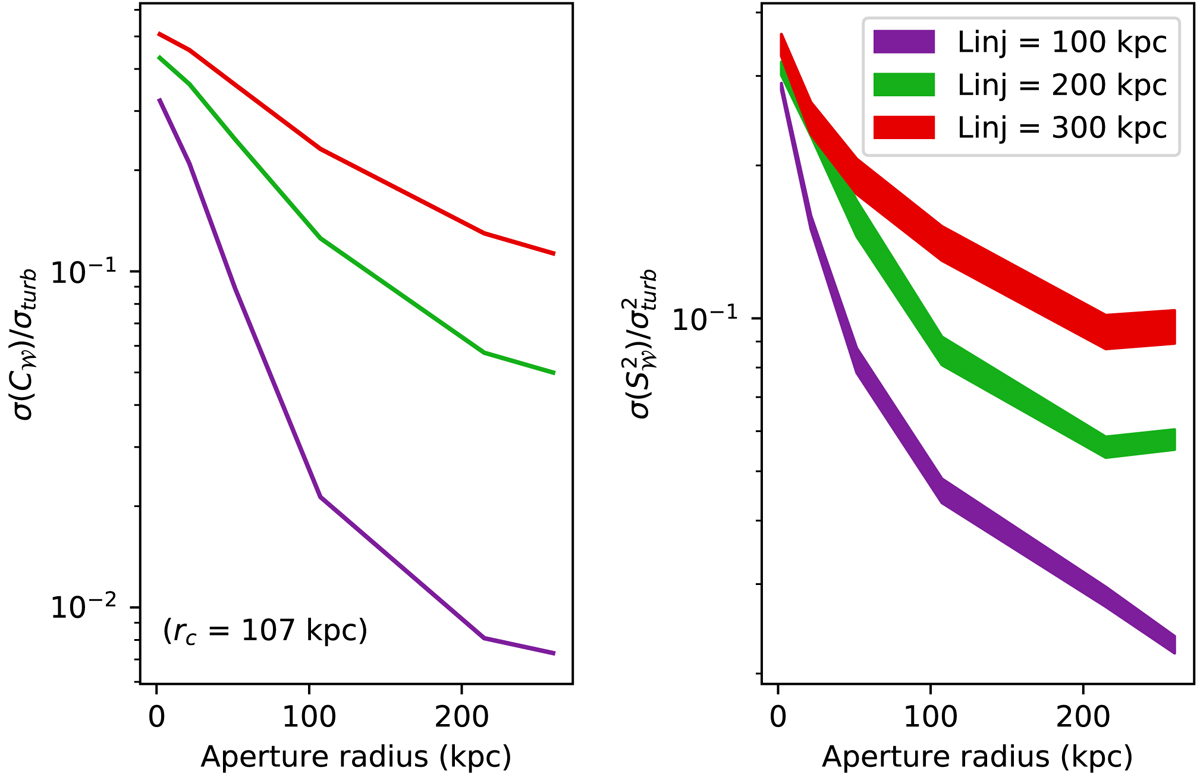
Sample variance associated to line measurements. The centroid shift (left) and broadening (right) in apertures of growing sizes for clusters presenting identical emissivity models are shown for a spherical β-model with core radius of 107 kpc. These curves are predicted analytically by Eqs. (9) and (11). They have been normalised to the value of the 3D turbulent velocity dispersion σturb. The different shapes of the curves as the aperture radius grows can be used as a diagnostic to discriminate between various injection scales.
Current usage metrics show cumulative count of Article Views (full-text article views including HTML views, PDF and ePub downloads, according to the available data) and Abstracts Views on Vision4Press platform.
Data correspond to usage on the plateform after 2015. The current usage metrics is available 48-96 hours after online publication and is updated daily on week days.
Initial download of the metrics may take a while.