Fig. 5.
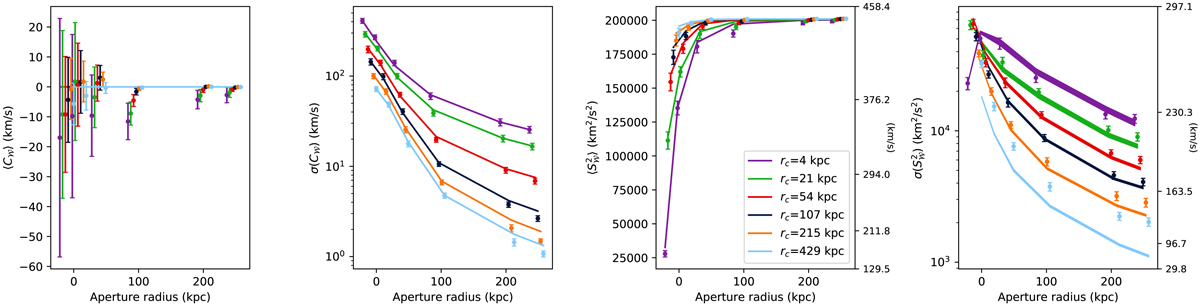
Numerical validation of Eqs. (8)–(11). These are the expected value and sample variance of the line centroid shift C𝒲 (first and second panel) and the expected value and sample variance of the line width ![]() (third and fourth panel). Plain lines show the analytical calculations, and data points are measured on 11 numerical realisations of a turbulent field (errors estimated via bootstrap) with Linj = 100 kpc. The calculations are performed assuming measurements in circular apertures 𝒲 of various radii (x-axis). The emissivity model is Xbeta with core radii indicated in the legend. The uncertainty on the analytical results for σ(S2) (shown by the line widths in the last panel) is due to limitations of the numerical integrator used to evaluate Eq. (11).
(third and fourth panel). Plain lines show the analytical calculations, and data points are measured on 11 numerical realisations of a turbulent field (errors estimated via bootstrap) with Linj = 100 kpc. The calculations are performed assuming measurements in circular apertures 𝒲 of various radii (x-axis). The emissivity model is Xbeta with core radii indicated in the legend. The uncertainty on the analytical results for σ(S2) (shown by the line widths in the last panel) is due to limitations of the numerical integrator used to evaluate Eq. (11).
Current usage metrics show cumulative count of Article Views (full-text article views including HTML views, PDF and ePub downloads, according to the available data) and Abstracts Views on Vision4Press platform.
Data correspond to usage on the plateform after 2015. The current usage metrics is available 48-96 hours after online publication and is updated daily on week days.
Initial download of the metrics may take a while.