Fig. 4.
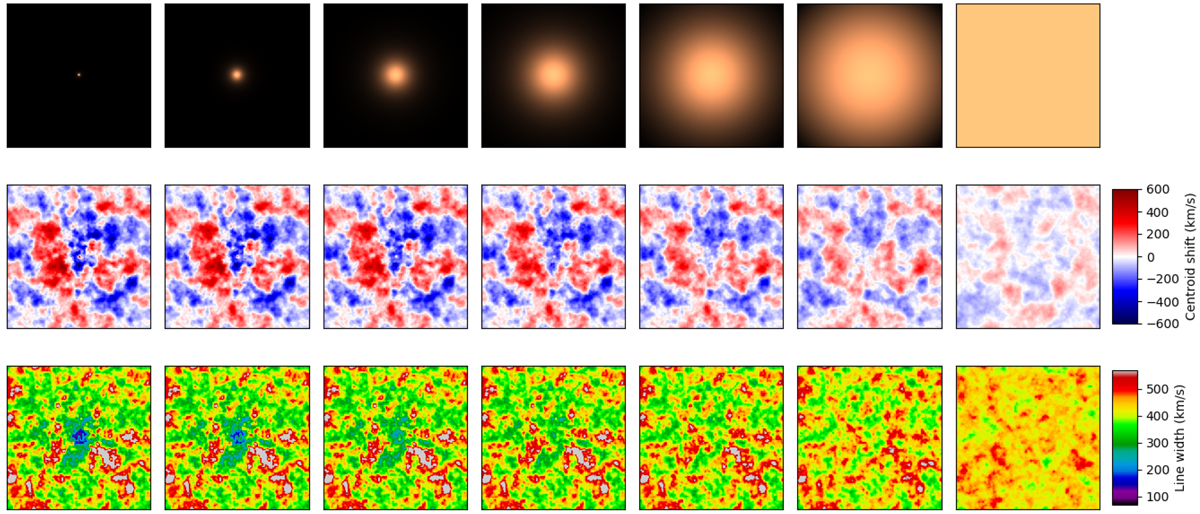
Projection of a single realisation of a 3D velocity field (injection scale at 200 kpc) with several emissivity models (top row). All but the last column correspond to spherical β-models with core-radii of 4, 21, 54, 107, 215, and 429 kpc (from left to right). The rightmost column corresponds to a constant emissivity in the entire simulation box. The size of each panel is 520 kpc on a side. The middle row shows the centroid shift (C) and the bottom row shows the line width (![]() ). The decrease in contrast (or power) can be noticeably seen as the core radius increases. The small line broadening seen through a small cluster core appears clearly in the bottom-left figure.
). The decrease in contrast (or power) can be noticeably seen as the core radius increases. The small line broadening seen through a small cluster core appears clearly in the bottom-left figure.
Current usage metrics show cumulative count of Article Views (full-text article views including HTML views, PDF and ePub downloads, according to the available data) and Abstracts Views on Vision4Press platform.
Data correspond to usage on the plateform after 2015. The current usage metrics is available 48-96 hours after online publication and is updated daily on week days.
Initial download of the metrics may take a while.