Fig. 3.
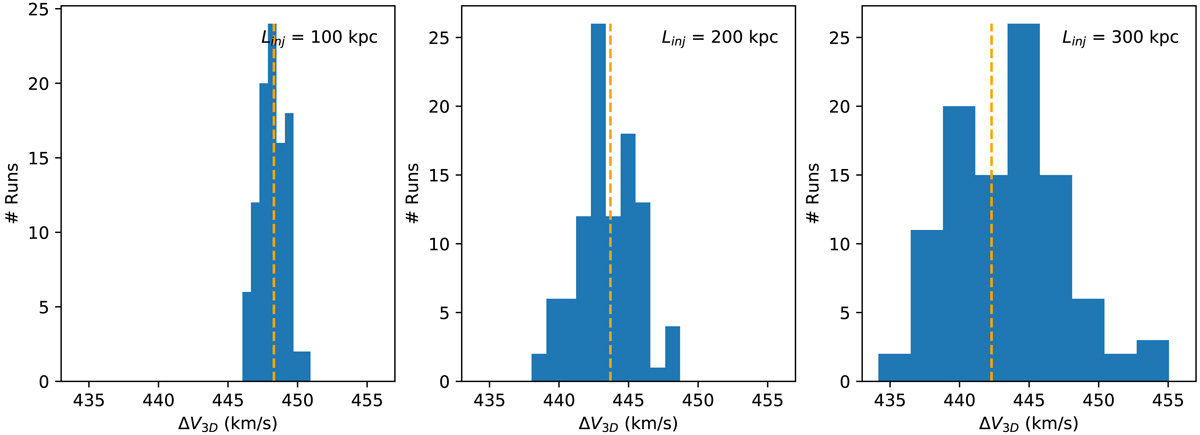
Effect of the finite box size on the precision of our numerical simulations. Three-dimensional velocity dispersion ΔV3D in each of the 100 numerical realisations for the three configurations in Table 1 is shown as blue histograms. Vertical dashed line indicates the exact value of σturb from integration of the input turbulent power-spectrum (Eq. (14)). The increased numerical dispersions in those values as Linj increases as a consequence of the finite simulation box size.
Current usage metrics show cumulative count of Article Views (full-text article views including HTML views, PDF and ePub downloads, according to the available data) and Abstracts Views on Vision4Press platform.
Data correspond to usage on the plateform after 2015. The current usage metrics is available 48-96 hours after online publication and is updated daily on week days.
Initial download of the metrics may take a while.