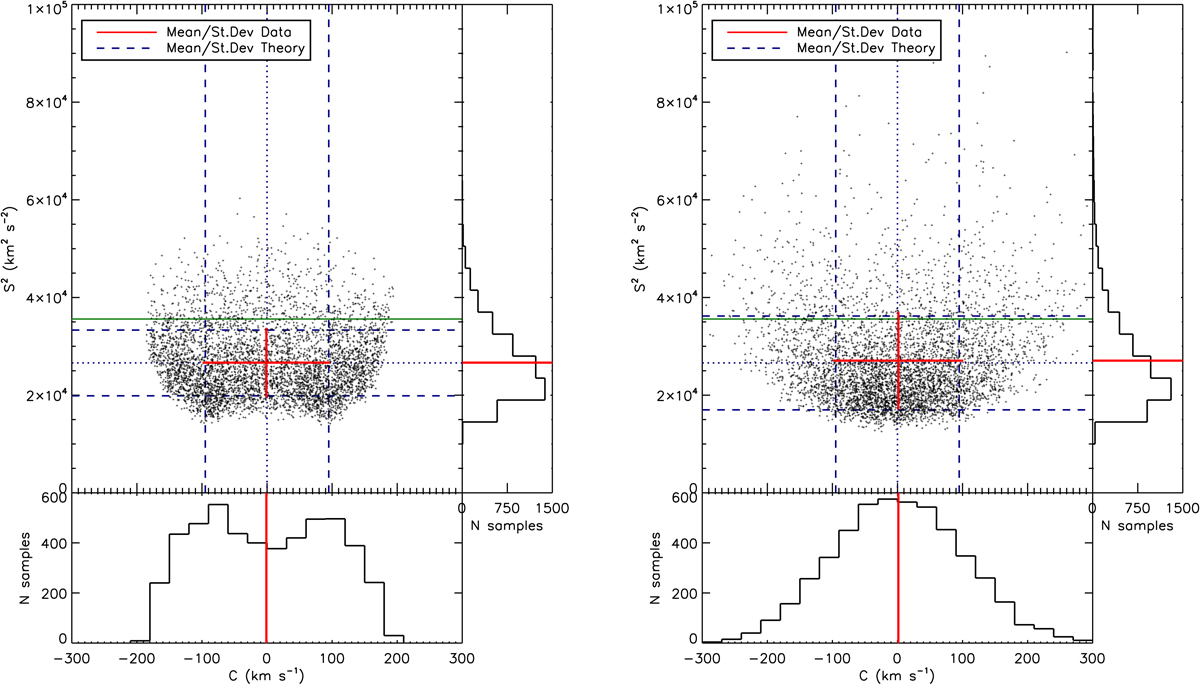
Fig. 2.

Line centroid C versus line width (squared) S2 of an emission line along a single line of sight and 5000 realisations of a one-dimensional turbulent velocity field (σturb = 160 km s−1, kmin = 1, kmax = 20, σth = 100 km s−1). Left panel: assumes only random phases while the right panel also includes randomly distributed moduli (Rayleigh distribution). Points show measurements, and the red cross is the measured mean and standard deviations along both axes. The blue lines represent the results obtained from analytical calculations (Eqs. (4)–(7)). The plain green line shows the location of the geometric mean of the turbulent and thermal dispersions: the presence of turbulent motions on scales comparable to that of the cluster makes such an estimate a biased one.
Current usage metrics show cumulative count of Article Views (full-text article views including HTML views, PDF and ePub downloads, according to the available data) and Abstracts Views on Vision4Press platform.
Data correspond to usage on the plateform after 2015. The current usage metrics is available 48-96 hours after online publication and is updated daily on week days.
Initial download of the metrics may take a while.


