Fig. 13.
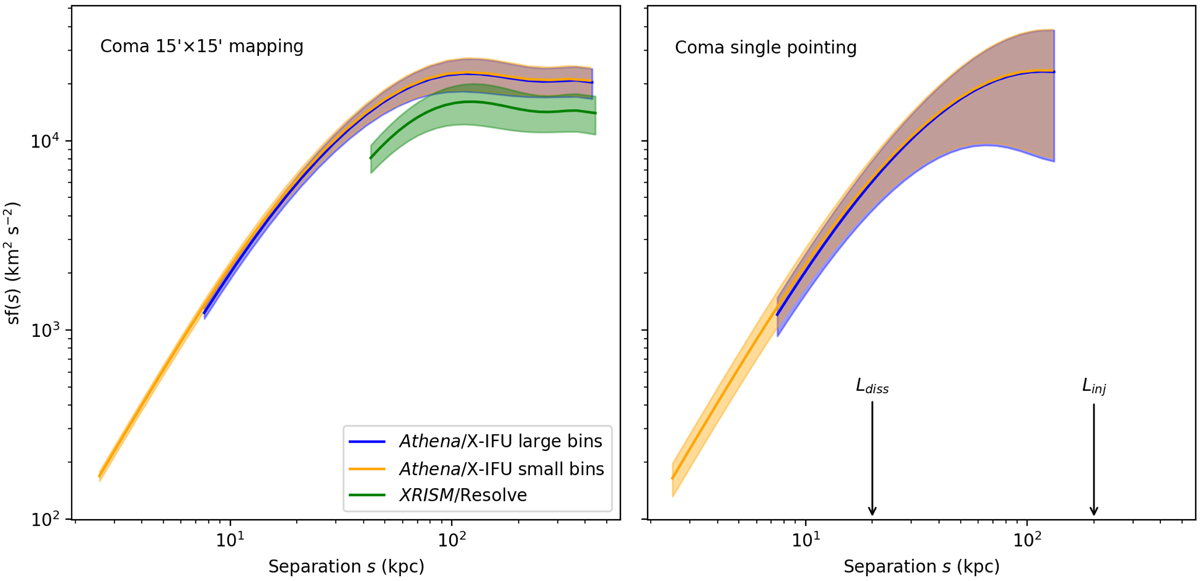
Model predictions for structure functions and their associated sample variances under two instrumental setups: XRISM/Resolve (assuming 1.5′ resolution elements) and Athena/X-IFU (assuming 5″ and 15″ resolution elements for high and low signal-to-noise ratios respectively). Left panel: predictions for a ∼15′×15′ contiguous mapping of the Coma cluster while the right panel shows the result for a single X-IFU pointing. A single Resolve pointing (3′ on a side) would be too small for a useful derivation of the structure function. The text gives further details on the input turbulent power spectrum and gas density model.
Current usage metrics show cumulative count of Article Views (full-text article views including HTML views, PDF and ePub downloads, according to the available data) and Abstracts Views on Vision4Press platform.
Data correspond to usage on the plateform after 2015. The current usage metrics is available 48-96 hours after online publication and is updated daily on week days.
Initial download of the metrics may take a while.