Fig. 11.
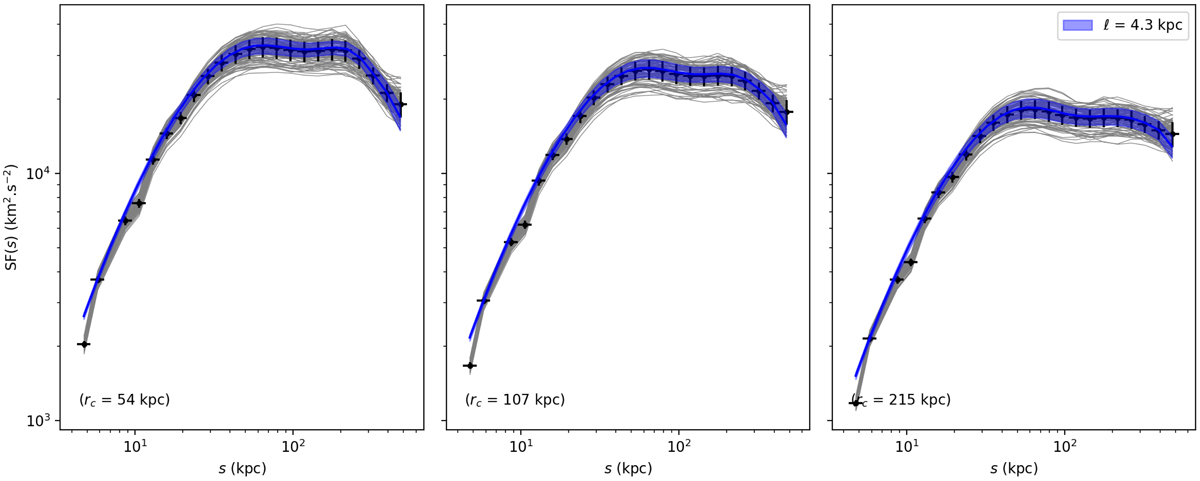
Comparison of the simulated and calculated structure function in a similar way as Fig. 8, except the emissivity model is of type beta (spherical β-model gas density). This induces non-stationarity of the projected velocity field, noticeable by the drop at large s. The coloured curves represent the analytical calculation of the mean structure function following Eqs. (12) and (D.3). For simplicity, the variance remains calculated according to Eq. (13), that is assuming Xbeta emissivity with an effective core radius, ![]() with θeff = 80 kpc.
with θeff = 80 kpc.
Current usage metrics show cumulative count of Article Views (full-text article views including HTML views, PDF and ePub downloads, according to the available data) and Abstracts Views on Vision4Press platform.
Data correspond to usage on the plateform after 2015. The current usage metrics is available 48-96 hours after online publication and is updated daily on week days.
Initial download of the metrics may take a while.