Fig. 10.
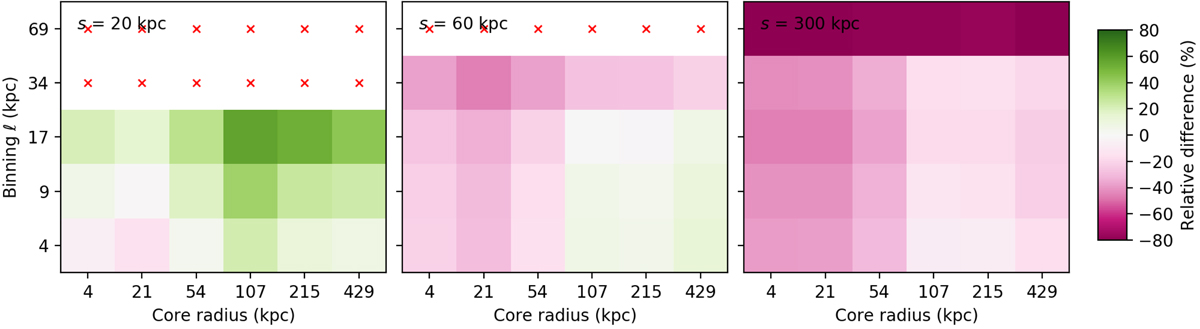
Similar to Fig. 9, but for the sample variance of the structure function, Var(SF). Positive values indicate higher predicted variance compared to that measured in the numerical validation procedure. Although some of these numbers are high at face value, it is important to recall the assumptions leading to the chosen analytical formula and the noise inherent in our set of numerical simulations (see text).
Current usage metrics show cumulative count of Article Views (full-text article views including HTML views, PDF and ePub downloads, according to the available data) and Abstracts Views on Vision4Press platform.
Data correspond to usage on the plateform after 2015. The current usage metrics is available 48-96 hours after online publication and is updated daily on week days.
Initial download of the metrics may take a while.