Fig. 1.
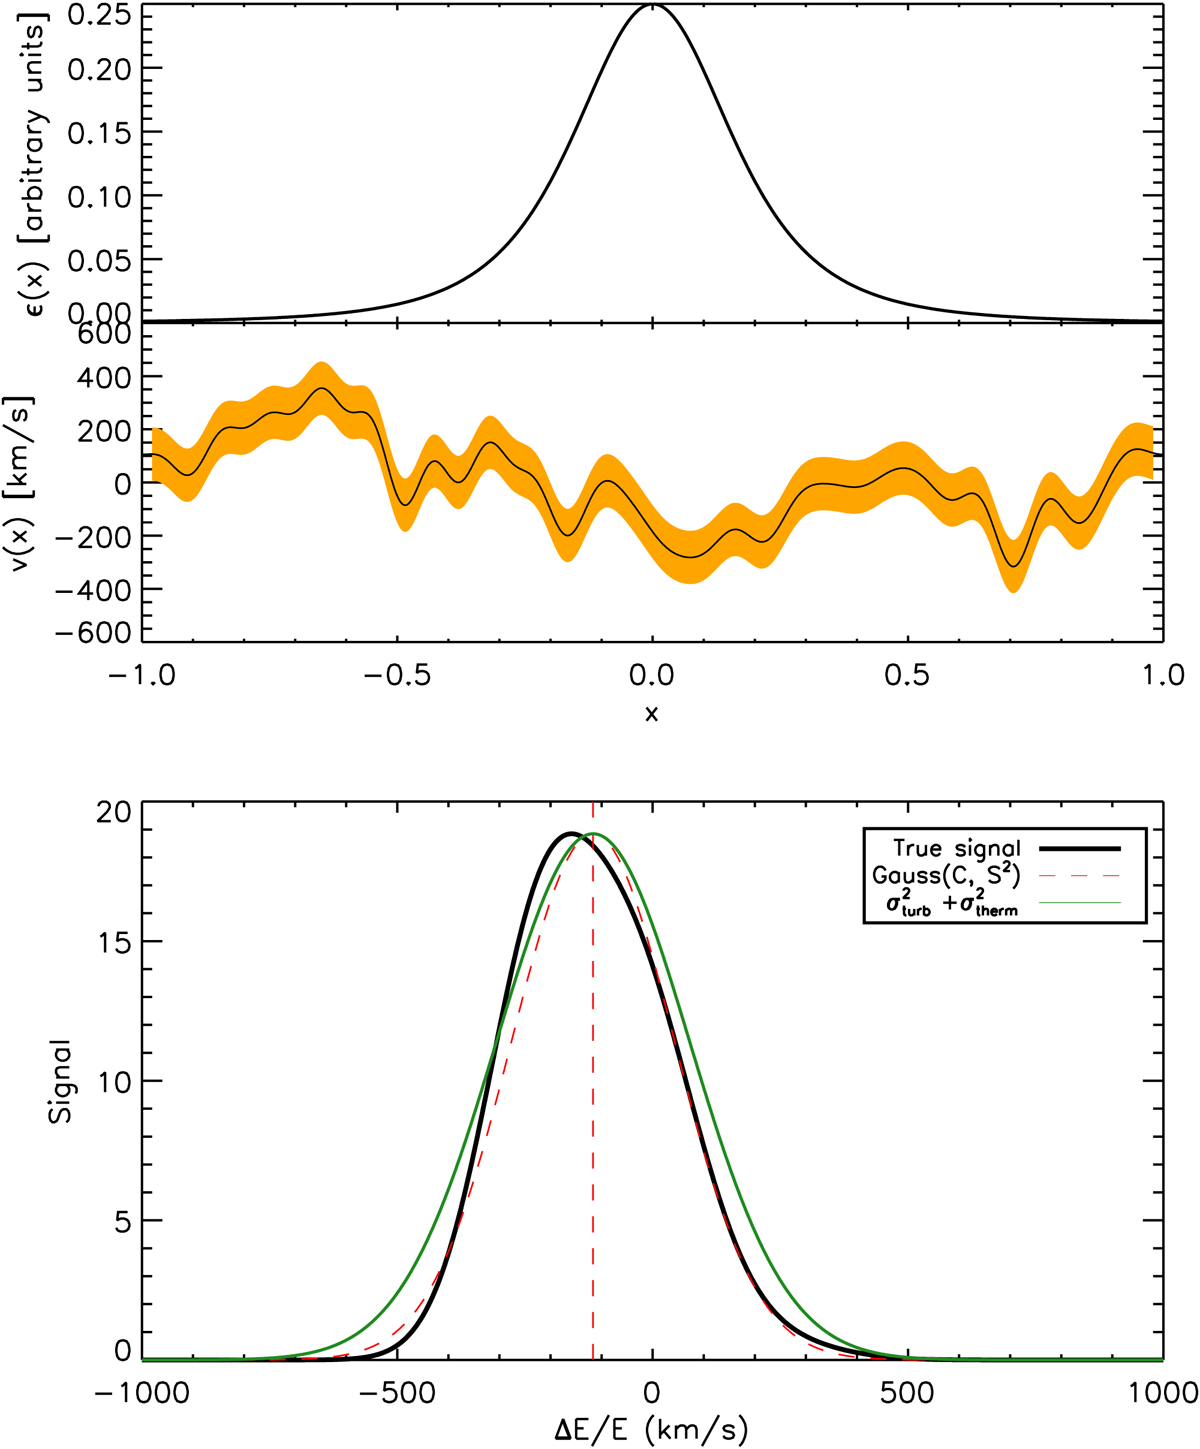
One realisation of a uni-dimensional turbulent velocity field (middle panel) along the spatial axis x (in arbitrary units) with parameters α = 1/3, kmin = 1 (Linj = 2), kmax = 20 (Ldiss = 0.1), σturb = 160 km s−1, and σth = 100 km s−1 (shown by yellow shading). The emissivity profile (top panel) of the gas corresponds to a β density model with core radius rc = 0.2 and at a distance θ = 0.2 from the centre. The lower panel shows the resulting line profile as a thick black line. The best-fit Gaussian centred on C (vertical line) of width S is shown as a dashed red line. The green thin curve shows the Gaussian centred on the line centroid. Its width equals the geometrical mean of the thermal and turbulent broadening.
Current usage metrics show cumulative count of Article Views (full-text article views including HTML views, PDF and ePub downloads, according to the available data) and Abstracts Views on Vision4Press platform.
Data correspond to usage on the plateform after 2015. The current usage metrics is available 48-96 hours after online publication and is updated daily on week days.
Initial download of the metrics may take a while.