Fig. 4.
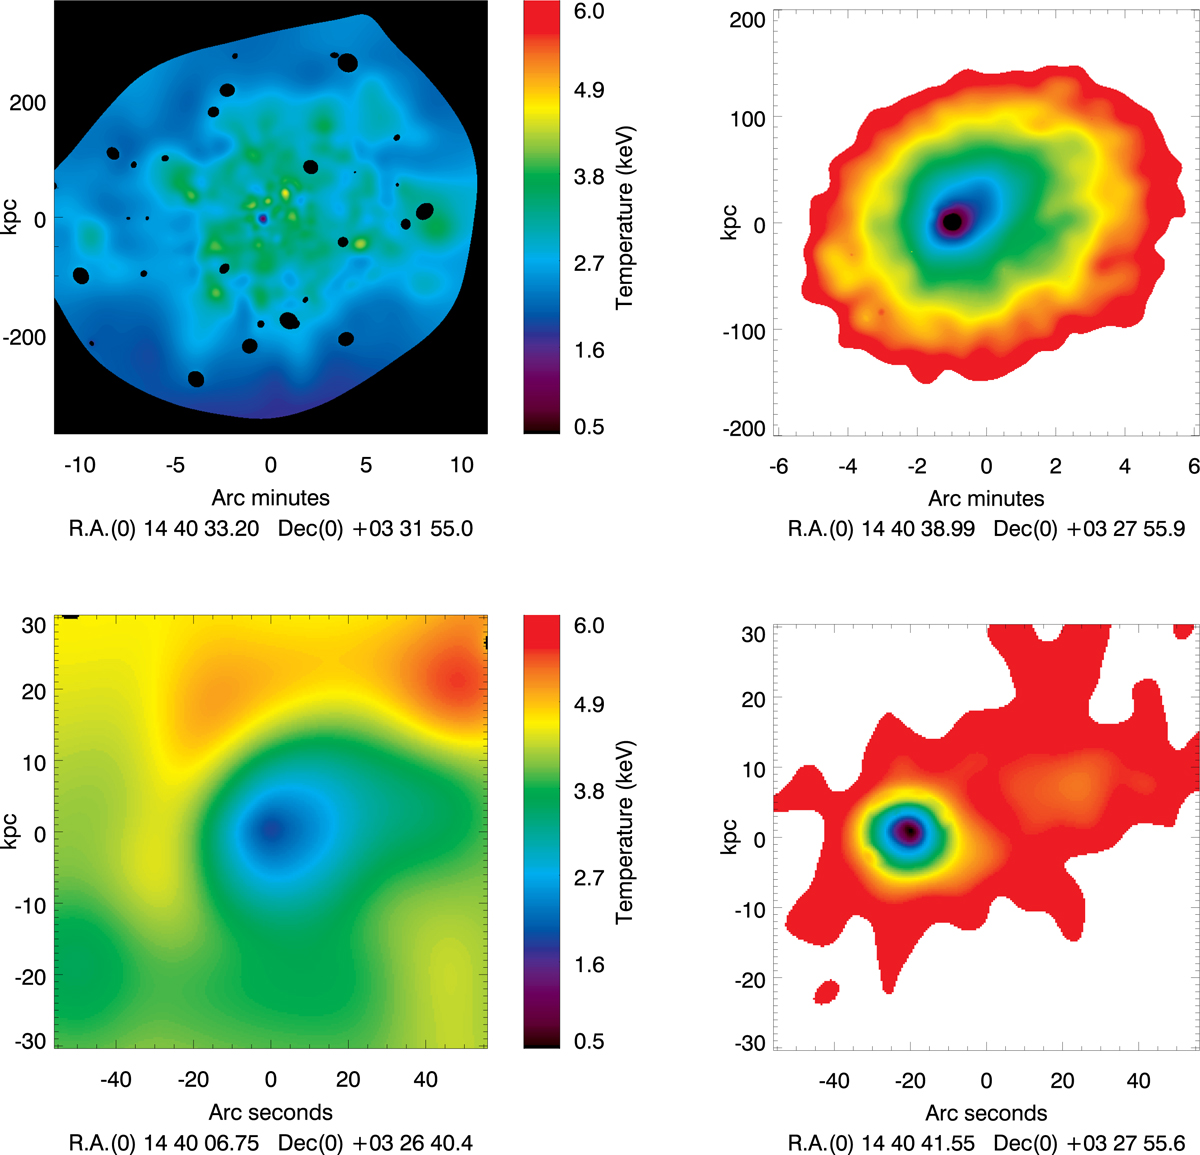
Upper panel: XMM-Newton temperature map (left) and surface brightness map (right). Lower panel: for the highest angular resolution, Chandra temperature map (left) and surface brightness map (right). Temperature maps are presented within 3σ errors. Surface brightness maps are obtained in soft energy band 0.3–2.5 keV within 4σ errors. Chandra maps are enlarged to emphasize the central region of the cluster.
Current usage metrics show cumulative count of Article Views (full-text article views including HTML views, PDF and ePub downloads, according to the available data) and Abstracts Views on Vision4Press platform.
Data correspond to usage on the plateform after 2015. The current usage metrics is available 48-96 hours after online publication and is updated daily on week days.
Initial download of the metrics may take a while.