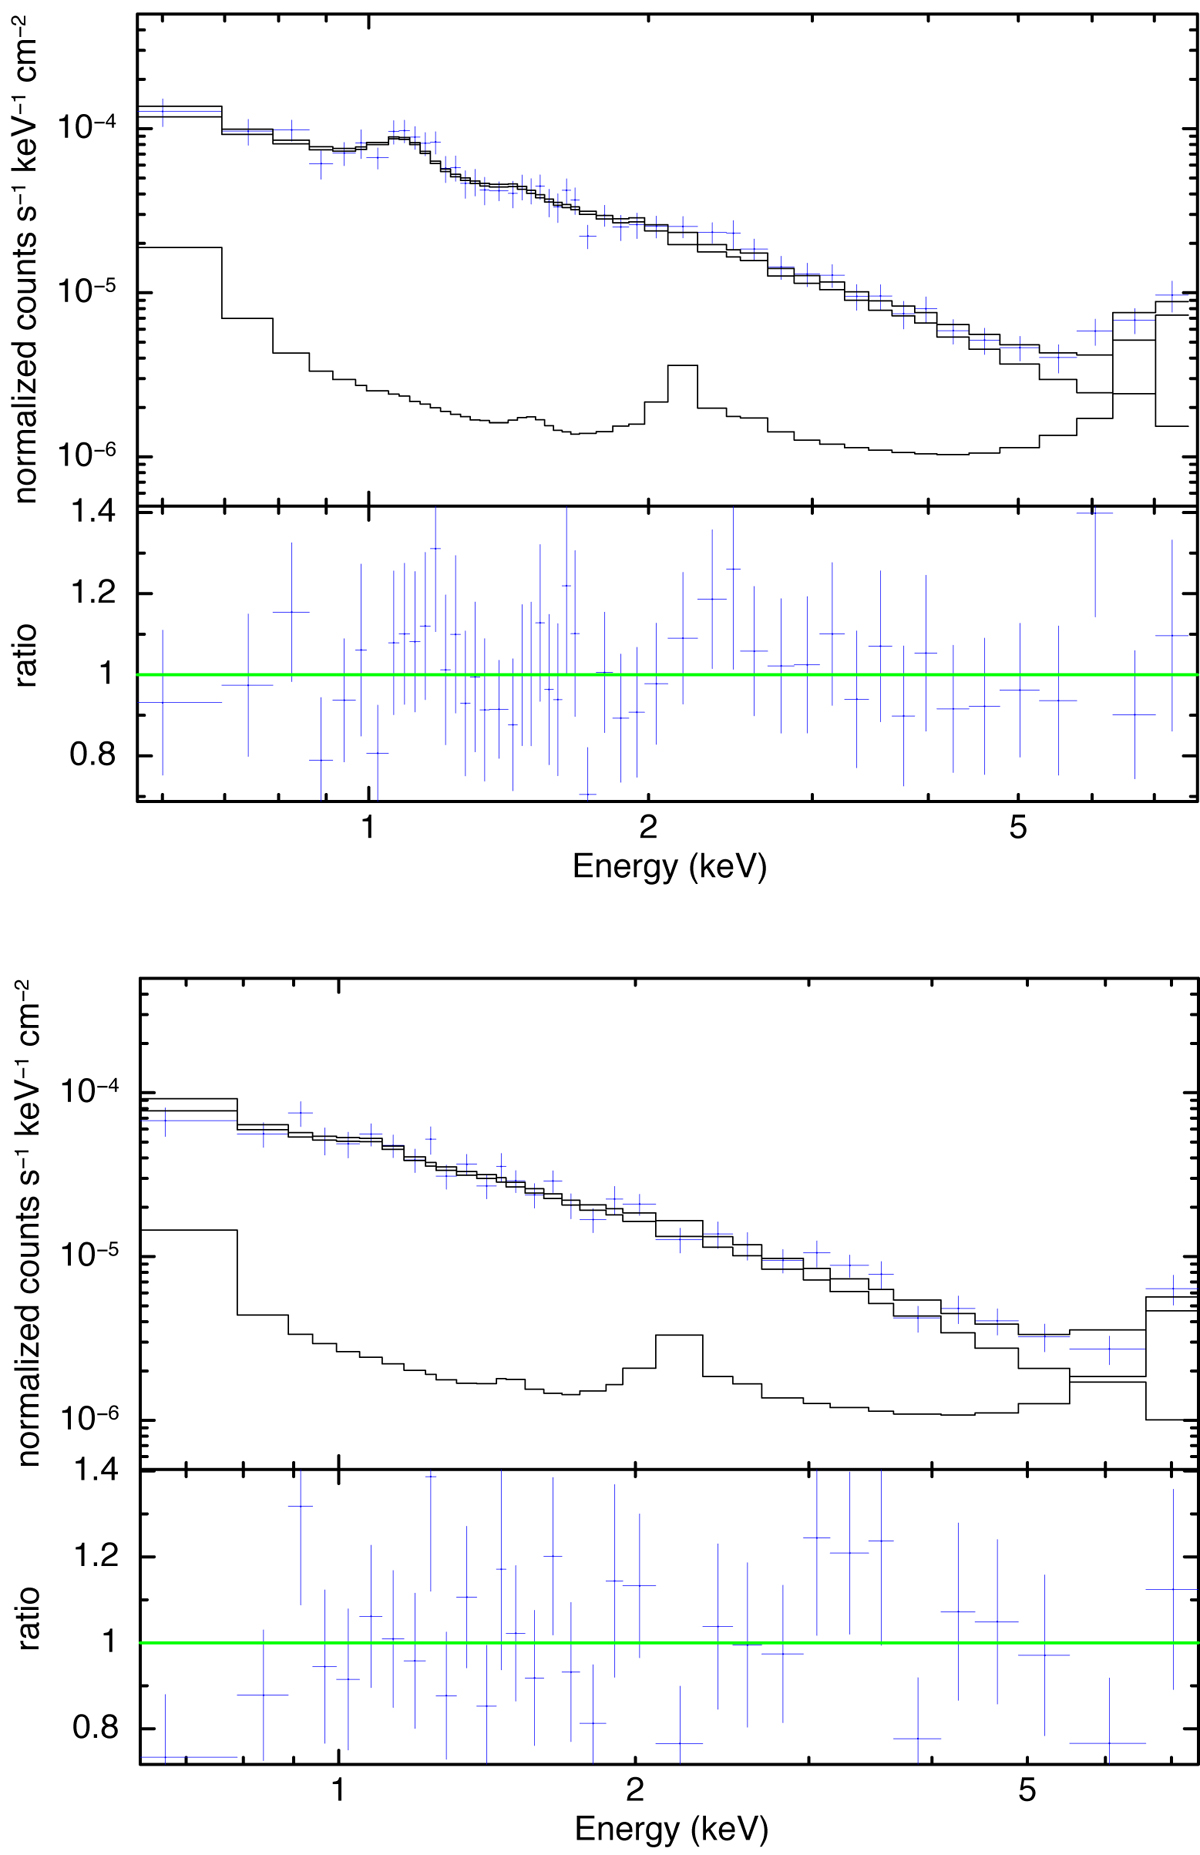
Fig. C.1.

Chandra spectral fitting of Sector 1 (upper) and Sector 2 (lower) with phabs × apec models. For plotting purposes only, adjacent bins are combined until they have a significant detection at least as large as 5σ, with maximum 10 bins. Upper curve corresponds to the simultaneous fit of the Chandra ACIS-I source and background counts, where the lower curve presents the background model in each panel.
Current usage metrics show cumulative count of Article Views (full-text article views including HTML views, PDF and ePub downloads, according to the available data) and Abstracts Views on Vision4Press platform.
Data correspond to usage on the plateform after 2015. The current usage metrics is available 48-96 hours after online publication and is updated daily on week days.
Initial download of the metrics may take a while.


