Fig. 10.
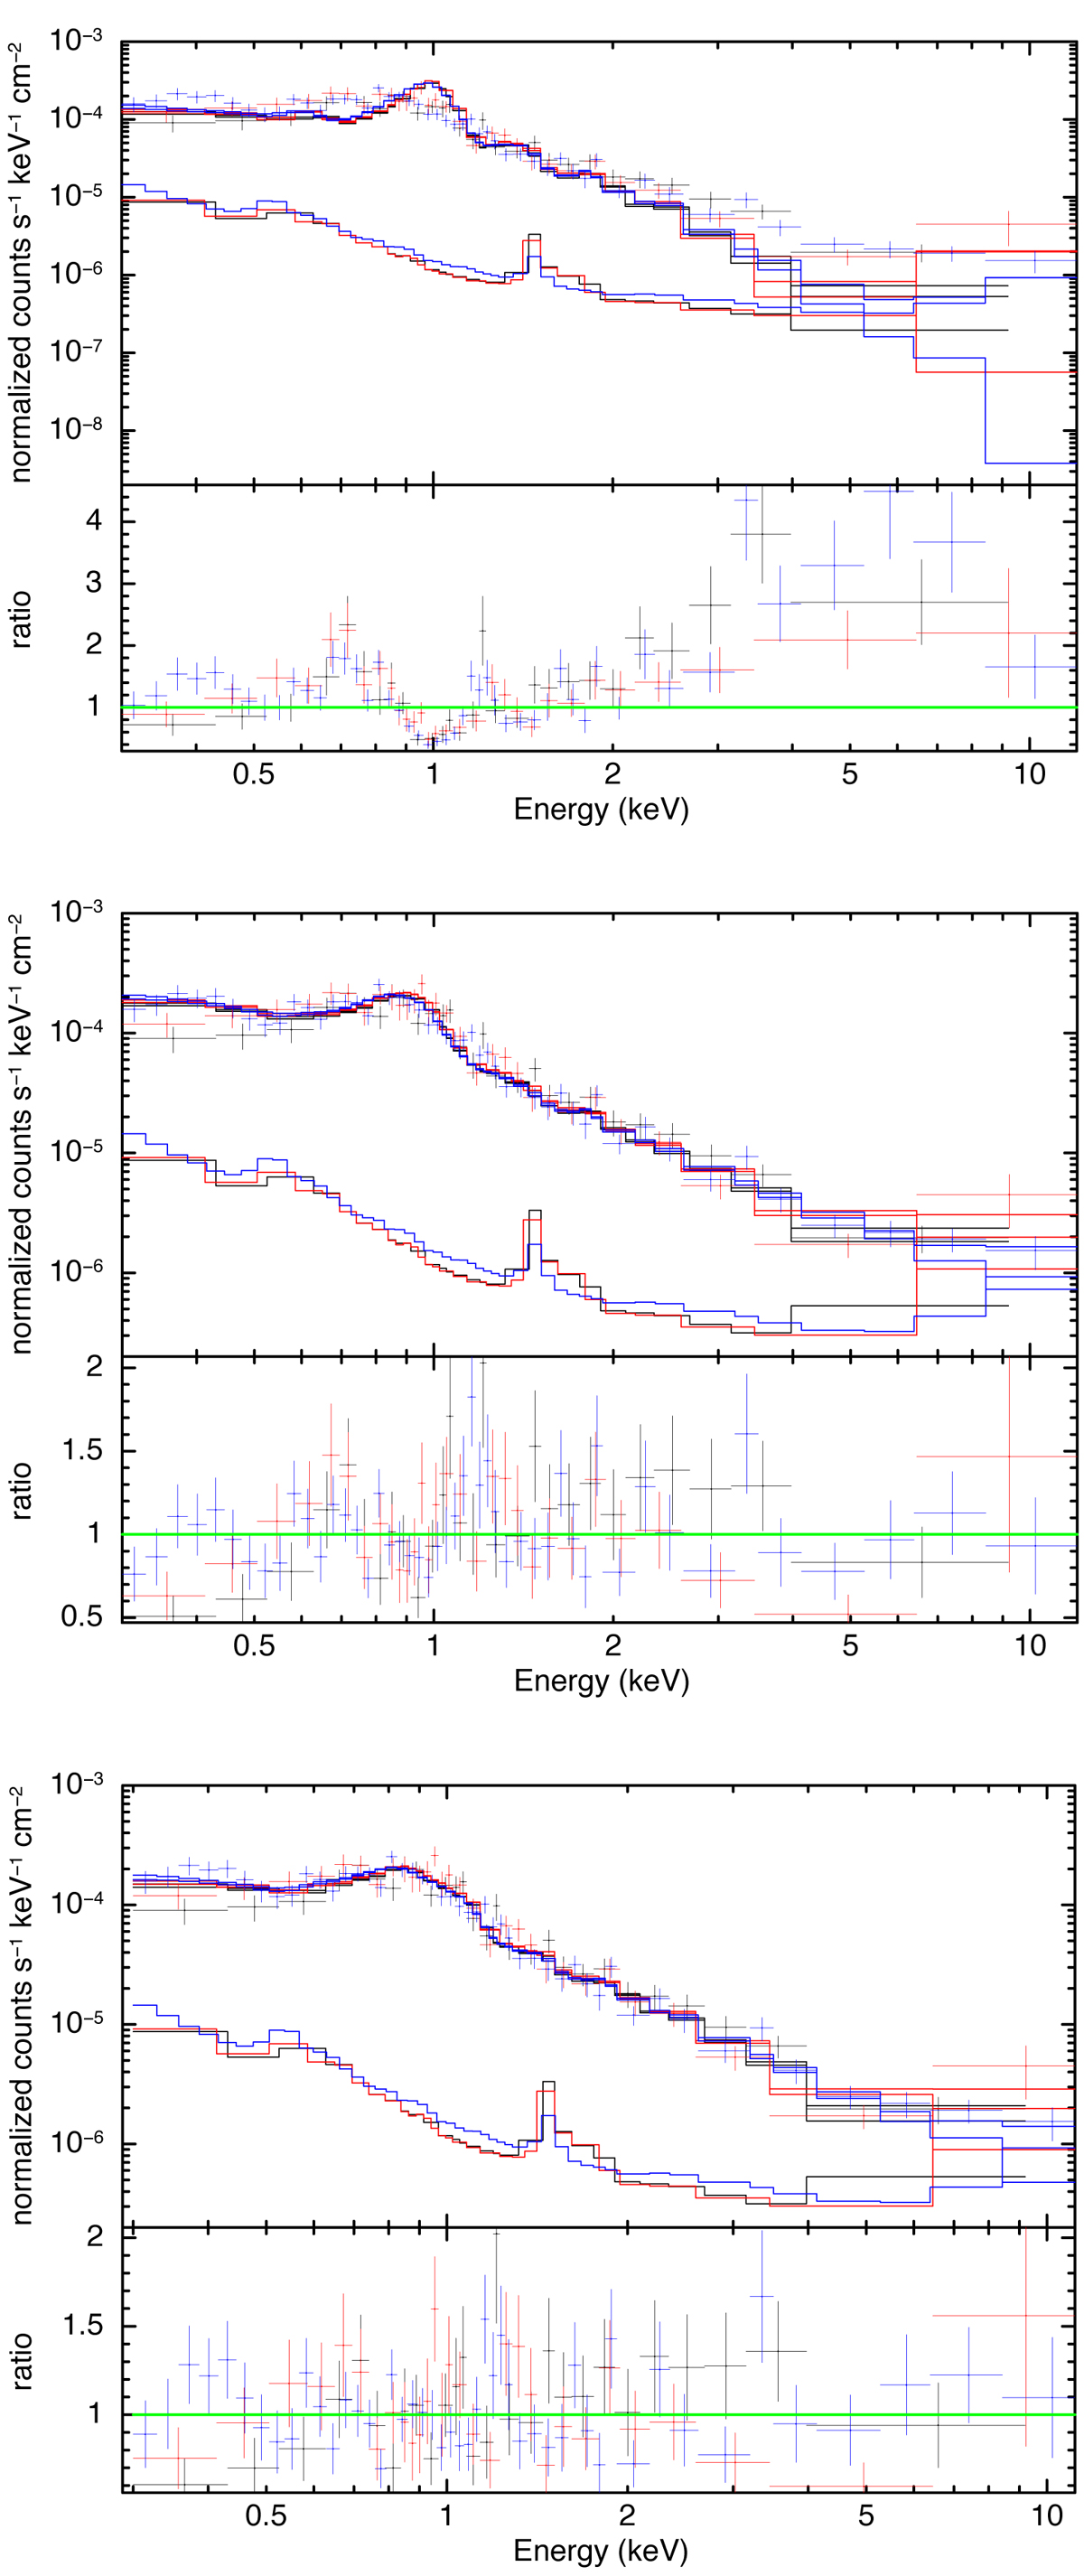
XMM-Newton spectral fitting of circular 10 kpc region centered at NGC 5718 with Model 1 (top), Model 2 (middle) and Model 3 (bottom). For plotting purposes only, adjacent bins are grouped until they have a significant detection at least as large as 4σ, with maximum 10 bins. Upper curve corresponds to the simultaneous fit of the XMM-Newton EPIC source and background counts, where the lower curve presents the background model.
Current usage metrics show cumulative count of Article Views (full-text article views including HTML views, PDF and ePub downloads, according to the available data) and Abstracts Views on Vision4Press platform.
Data correspond to usage on the plateform after 2015. The current usage metrics is available 48-96 hours after online publication and is updated daily on week days.
Initial download of the metrics may take a while.