Free Access
Fig. 6.
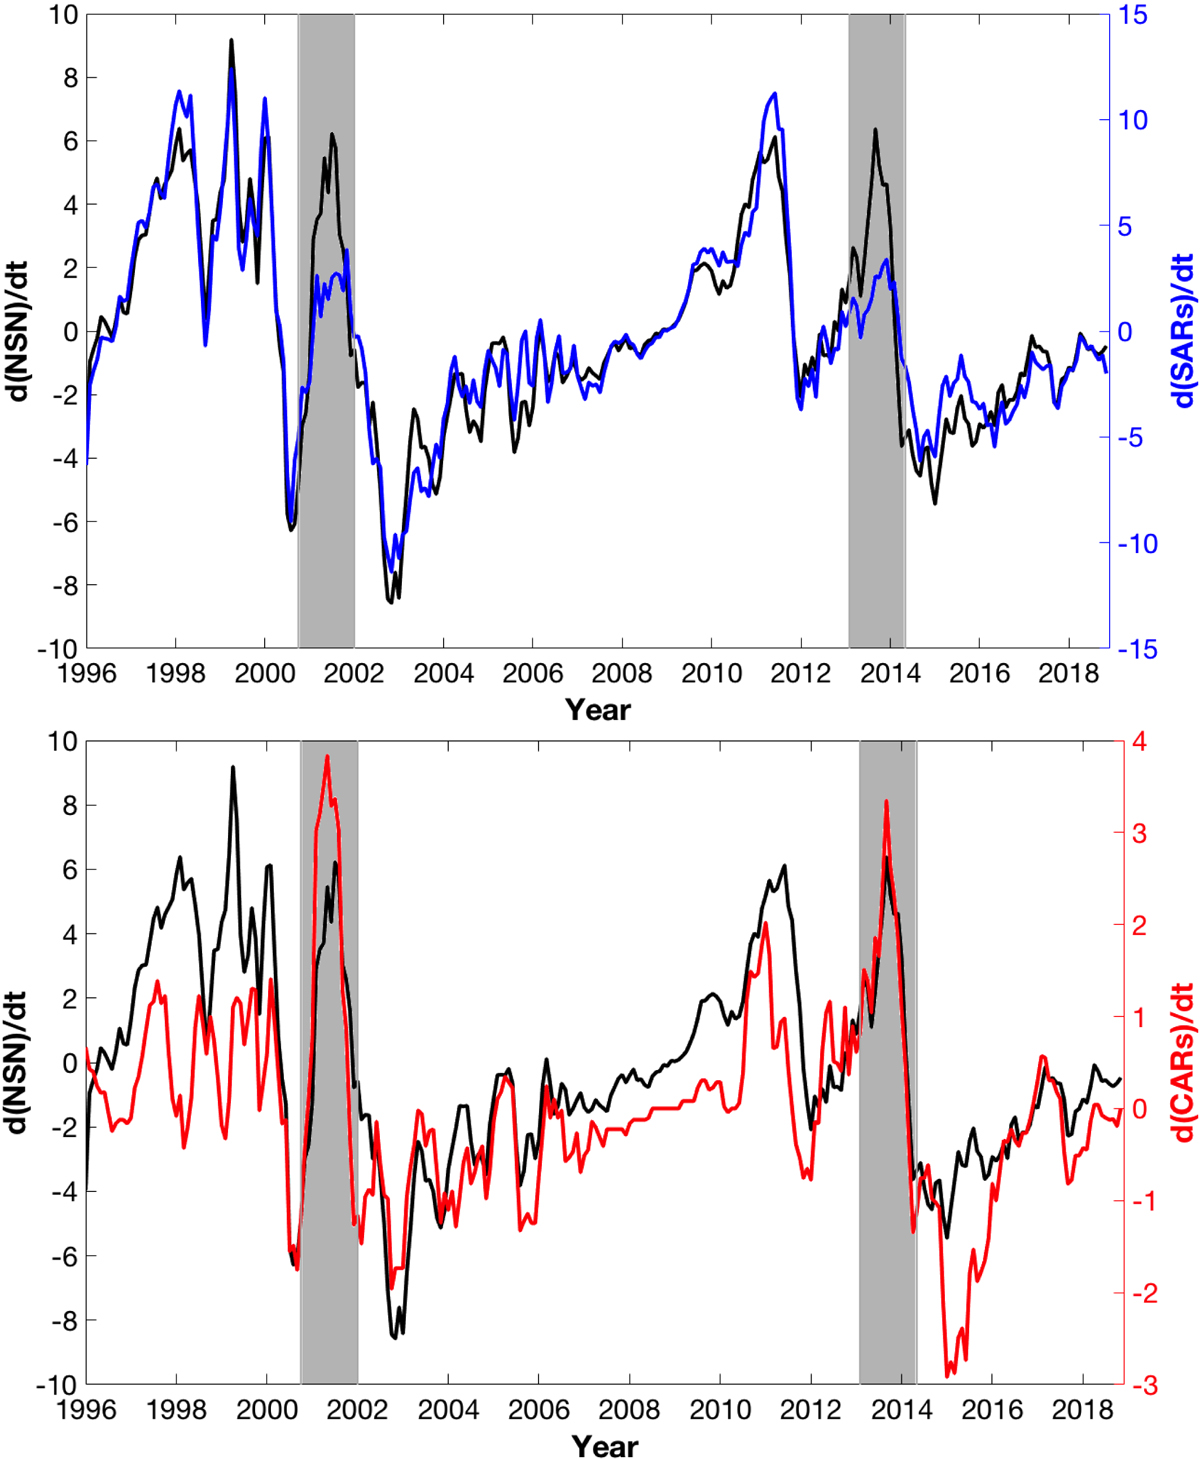
Upper panel: time variation of SARs (blue line) and the NSN (black line). Lower panel: time variation of CARs (red line) and the NSN (black line). Gray shaded bars show the periods when the largest difference between the time variation of SARs and the NSN happens.
Current usage metrics show cumulative count of Article Views (full-text article views including HTML views, PDF and ePub downloads, according to the available data) and Abstracts Views on Vision4Press platform.
Data correspond to usage on the plateform after 2015. The current usage metrics is available 48-96 hours after online publication and is updated daily on week days.
Initial download of the metrics may take a while.