Free Access
Fig. 5.
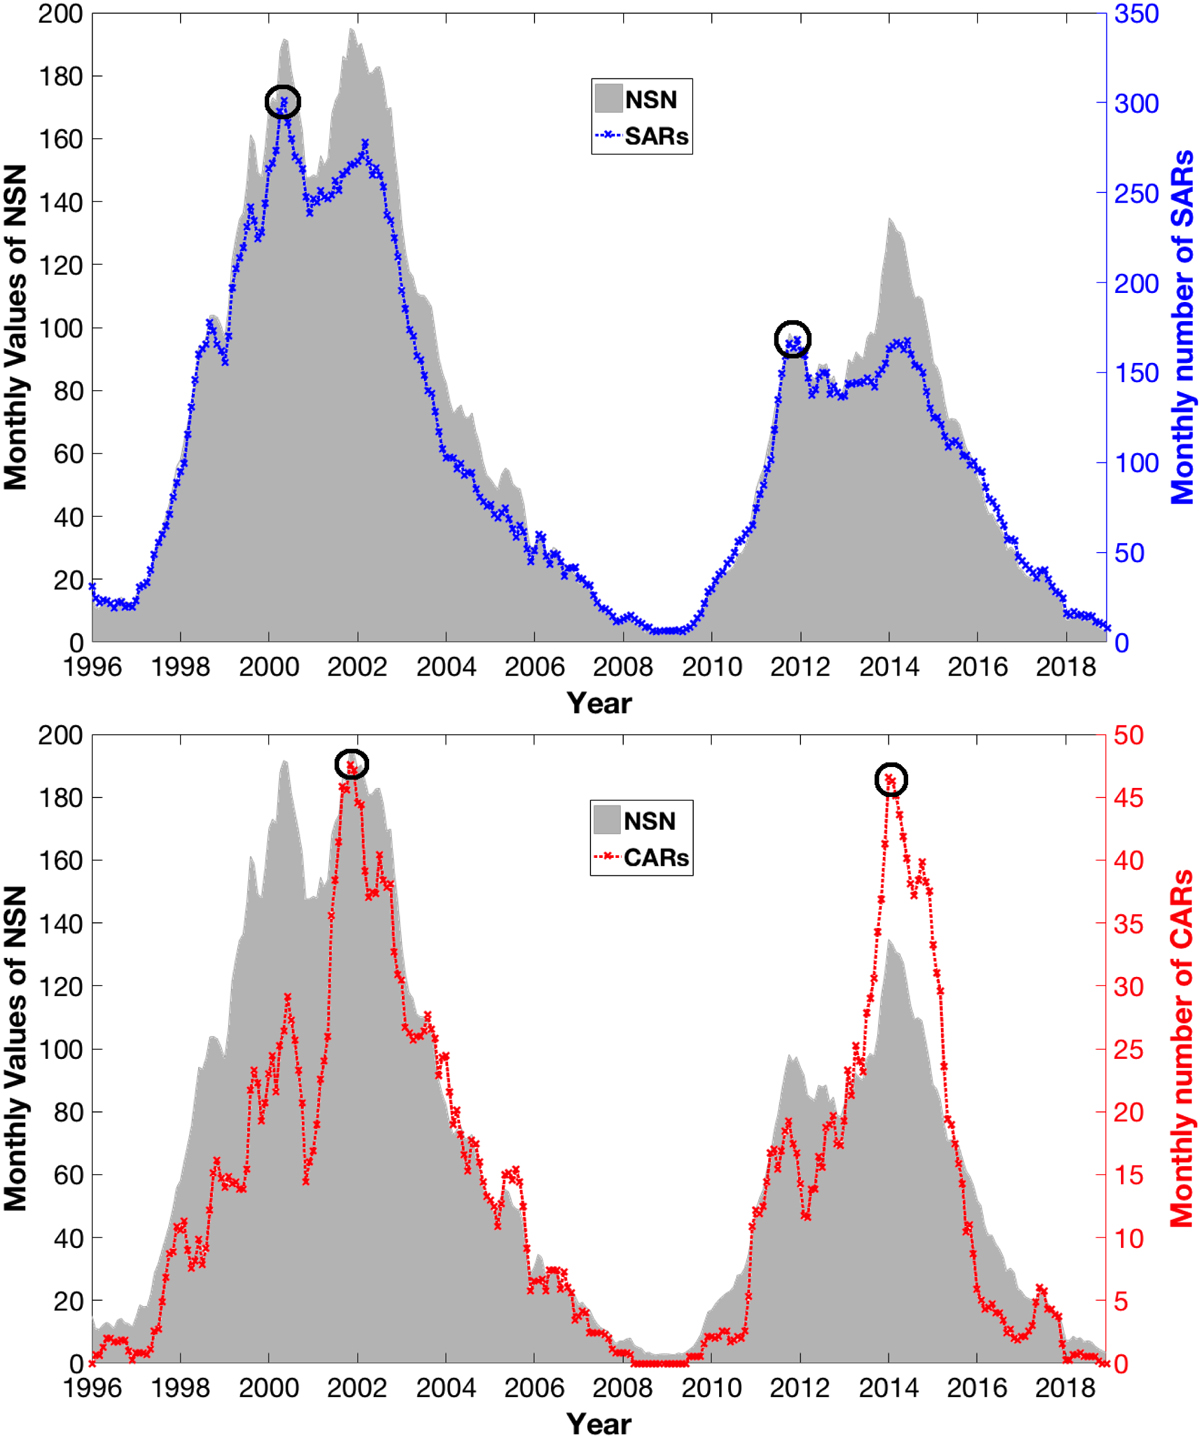
Monthly number of SARs (upper panel) and CARs (lower panel) in comparison with the monthly average values of the NSN (gray shaded areas). The maximum values of SARs and CARs are marked by circles in each cycle.
Current usage metrics show cumulative count of Article Views (full-text article views including HTML views, PDF and ePub downloads, according to the available data) and Abstracts Views on Vision4Press platform.
Data correspond to usage on the plateform after 2015. The current usage metrics is available 48-96 hours after online publication and is updated daily on week days.
Initial download of the metrics may take a while.