Fig. 3.
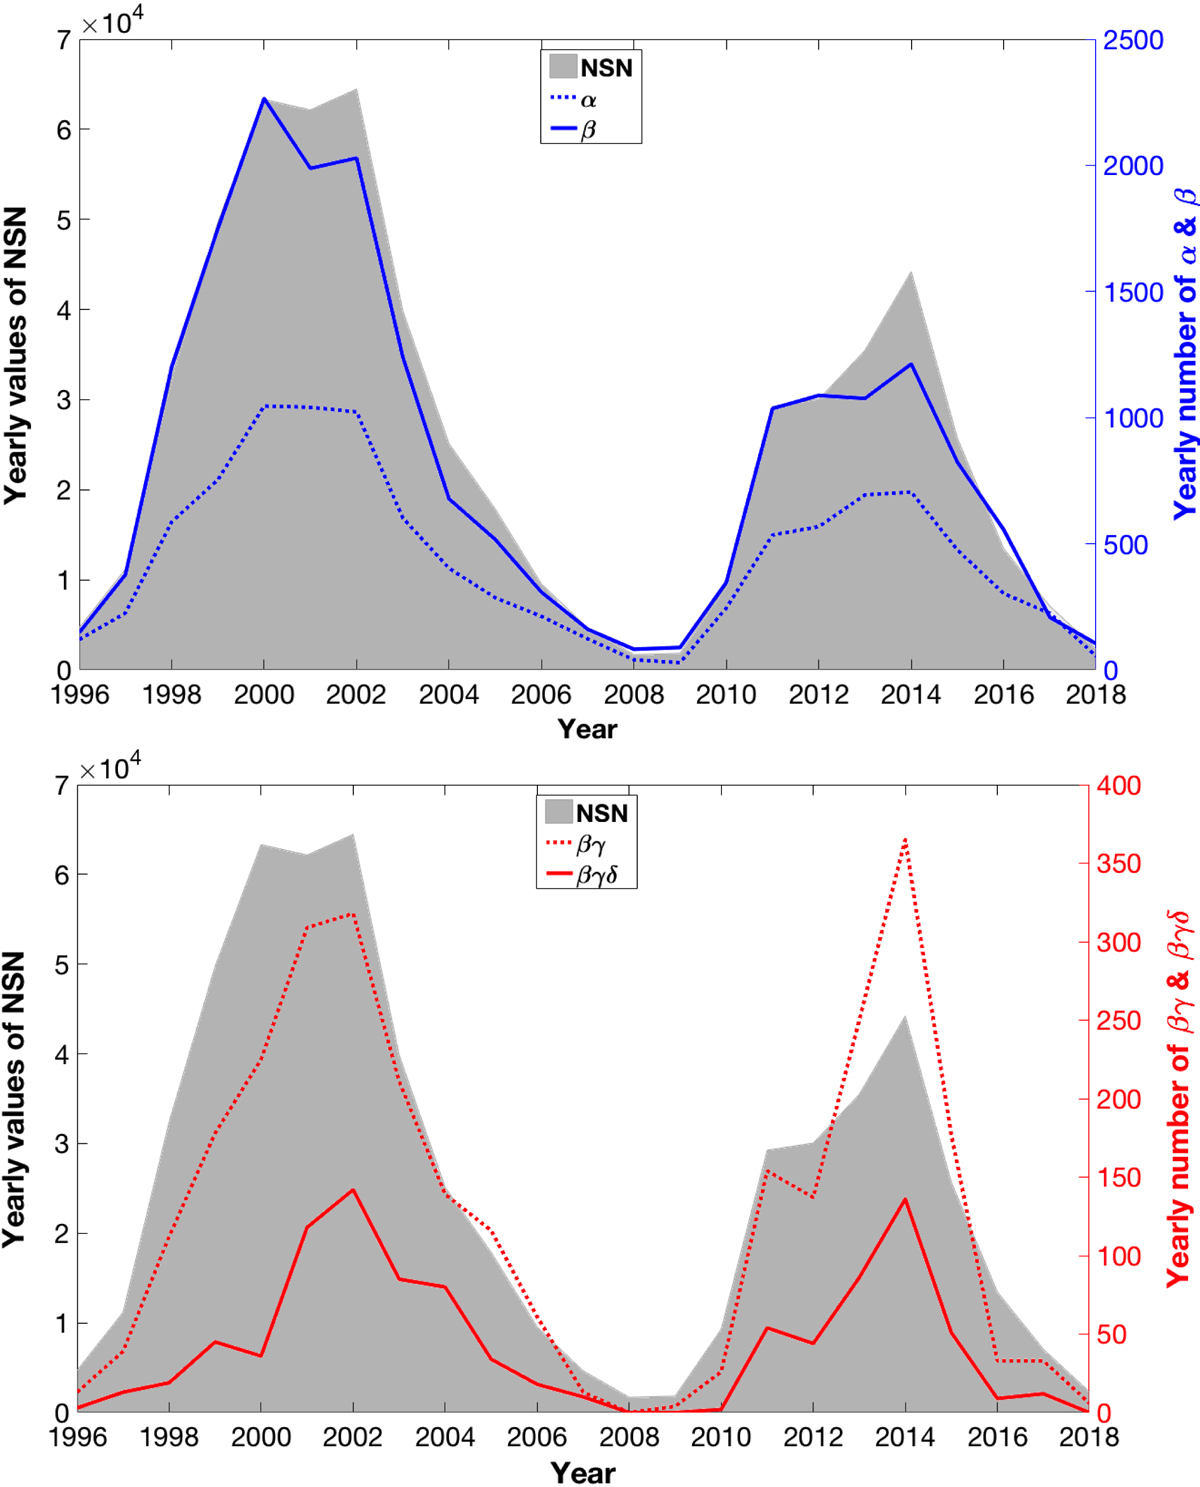
Yearly numbers of the most common magnetic complexities in comparison with the yearly average values of the NSN (gray shaded area). Upper panel: yearly number of the α and β classes are shown with the blue solid and dotted lines, respectively. Lower panel: yearly values of the βγ (red dotted line) and βγδ classes (red solid line).
Current usage metrics show cumulative count of Article Views (full-text article views including HTML views, PDF and ePub downloads, according to the available data) and Abstracts Views on Vision4Press platform.
Data correspond to usage on the plateform after 2015. The current usage metrics is available 48-96 hours after online publication and is updated daily on week days.
Initial download of the metrics may take a while.