Fig. 8.
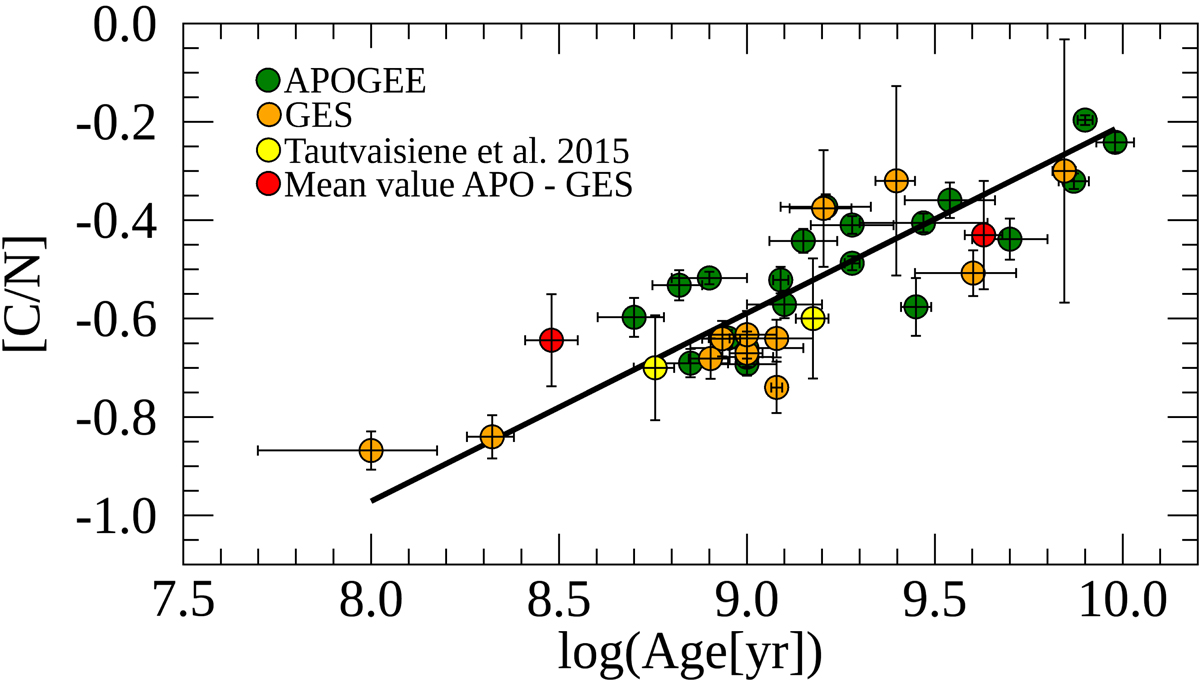
Average [C/N] ratios of cluster member stars with log g cut as a function of log(Age[yr]) for the GES (orange circles) and the APOGEE (green circles) surveys. The yellow circles represent the GES literature results by Tautvaišienė et al. (2015). The red circles represent the mean value [C/N] for NGC 6705 and M 67. The straight line is the linear weighted least-squares fit of the data.
Current usage metrics show cumulative count of Article Views (full-text article views including HTML views, PDF and ePub downloads, according to the available data) and Abstracts Views on Vision4Press platform.
Data correspond to usage on the plateform after 2015. The current usage metrics is available 48-96 hours after online publication and is updated daily on week days.
Initial download of the metrics may take a while.