Fig. 3.
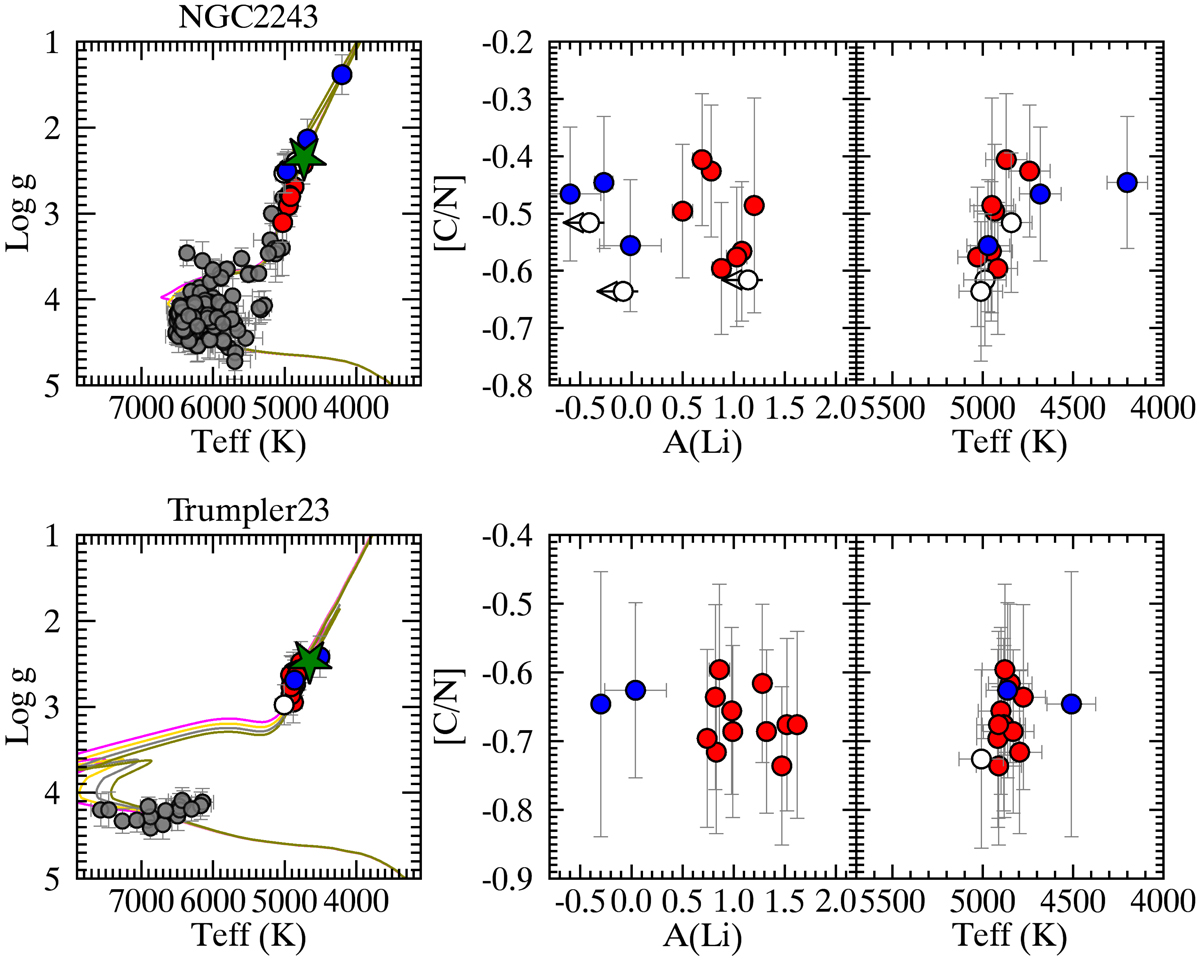
GES clusters NGC 2243 and Trumpler 23: log g-Teff diagrams with PISA isochrones 3.7, 4.0, 4.3, and 4.5 Gyr and 0.7, 0.8, 0.9, and 1.0 Gyr, respectively (left panels), and member stars beyond the FDU, A(Li) vs. [C/N] (central panel), and [C/N] abundance vs. Teff (right panel). Stars with A(Li) > 0.4 are shown with red circles, stars with A(Li) < 0.4 with blue circles, stars with upper limit measurements of A(Li) are indicated with empty circles, and main sequence, subgiant stars or stars without C and N are shown with grey circles. The green star represents the position of the RGB bump.
Current usage metrics show cumulative count of Article Views (full-text article views including HTML views, PDF and ePub downloads, according to the available data) and Abstracts Views on Vision4Press platform.
Data correspond to usage on the plateform after 2015. The current usage metrics is available 48-96 hours after online publication and is updated daily on week days.
Initial download of the metrics may take a while.