Free Access
Fig. 15.
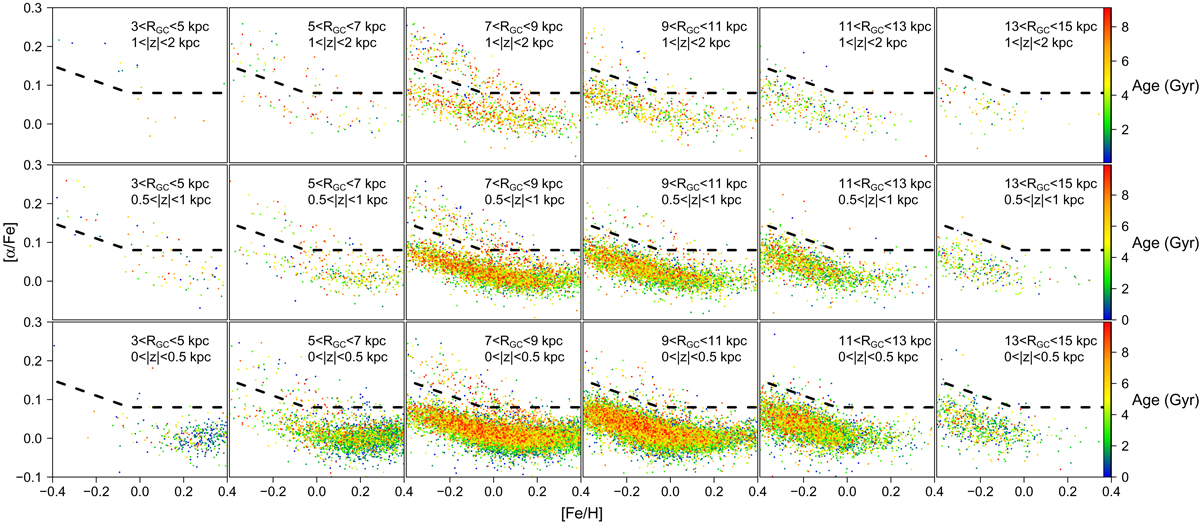
[α/Fe] as a function of [Fe/H] for field stars in the APOGEE sample. The stars are colour-coded by ages. The dashed line shows the separation between thin- and thick-disc populations. Each plot contains stars selected by means of Galactocentric radius RGC and height z, labelled in each figure.
Current usage metrics show cumulative count of Article Views (full-text article views including HTML views, PDF and ePub downloads, according to the available data) and Abstracts Views on Vision4Press platform.
Data correspond to usage on the plateform after 2015. The current usage metrics is available 48-96 hours after online publication and is updated daily on week days.
Initial download of the metrics may take a while.