Fig. 11.
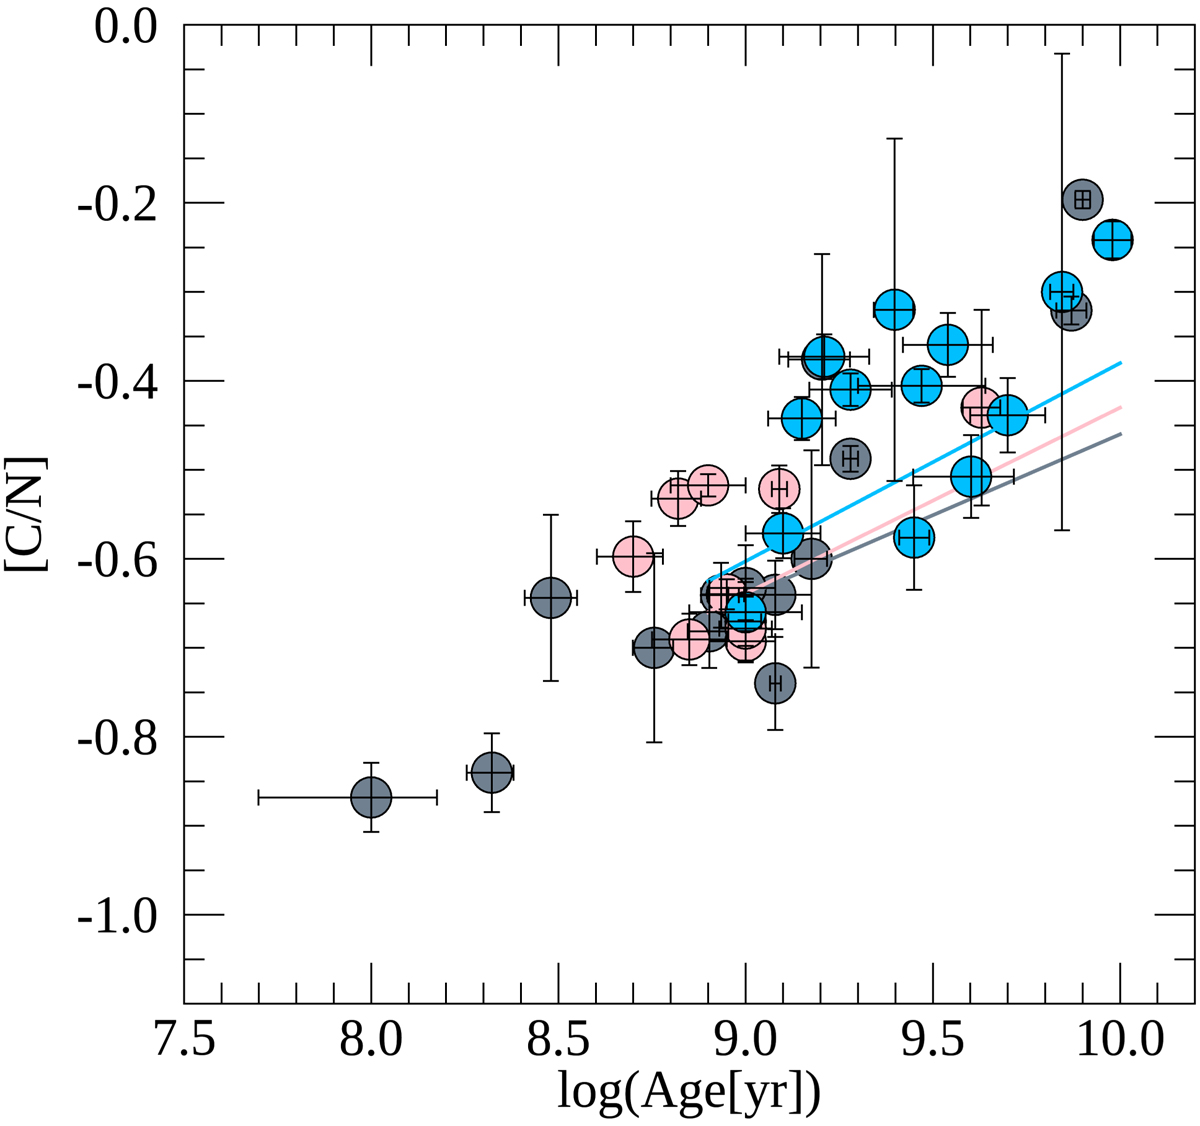
Comparison between age and [C/N] of the thin-disc RC giant modelled by Lagarde et al. (2017) (continuous lines in light blue, pink, and grey) and the clusters in GES and APOGEE. The clusters and models are divided into three metallicity bins: [Fe/H] ≤ −0.10 (light blue circles), −0.1 ≤ [Fe/H] ≤ +0.1 (pink circles), and [Fe/H] ≥ +0.1 (grey circles).
Current usage metrics show cumulative count of Article Views (full-text article views including HTML views, PDF and ePub downloads, according to the available data) and Abstracts Views on Vision4Press platform.
Data correspond to usage on the plateform after 2015. The current usage metrics is available 48-96 hours after online publication and is updated daily on week days.
Initial download of the metrics may take a while.