Fig. 10.
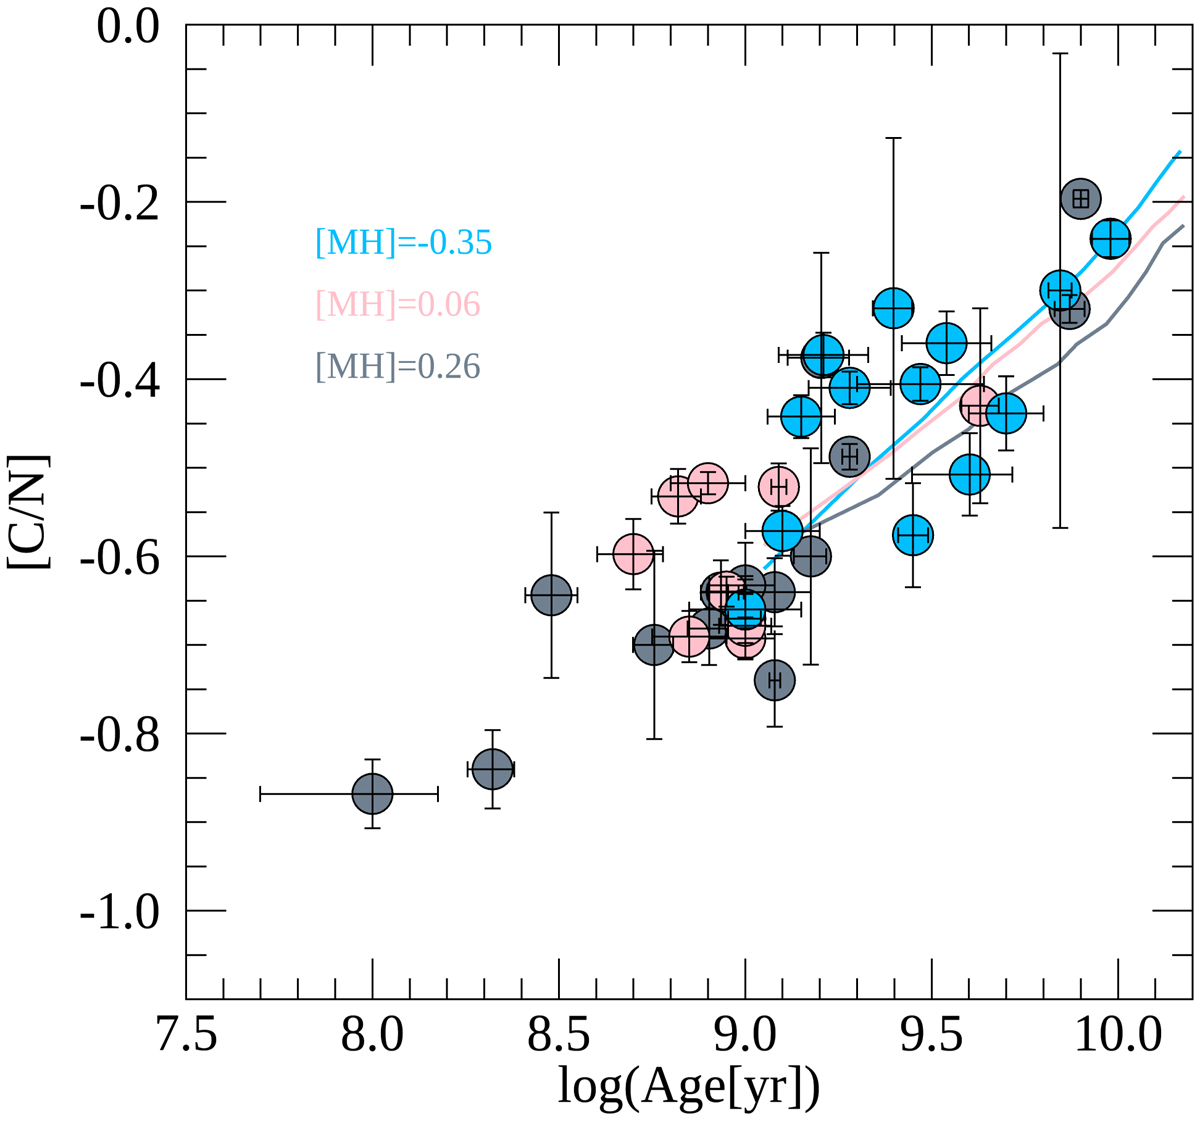
Comparison of [C/N] and age between the theoretical models by Salaris et al. (2015) and the open clusters in GES and APOGEE surveys. The models are computed for different metallicities. Their colour codes are shown in the legend. The clusters are divided into three metallicity bins: [Fe/H] ≤ −0.10 (light blue circles), −0.1 ≤ [Fe/H] ≤ +0.1 (pink circles), and [Fe/H] ≥ +0.1 (grey circles).
Current usage metrics show cumulative count of Article Views (full-text article views including HTML views, PDF and ePub downloads, according to the available data) and Abstracts Views on Vision4Press platform.
Data correspond to usage on the plateform after 2015. The current usage metrics is available 48-96 hours after online publication and is updated daily on week days.
Initial download of the metrics may take a while.