Fig. 9
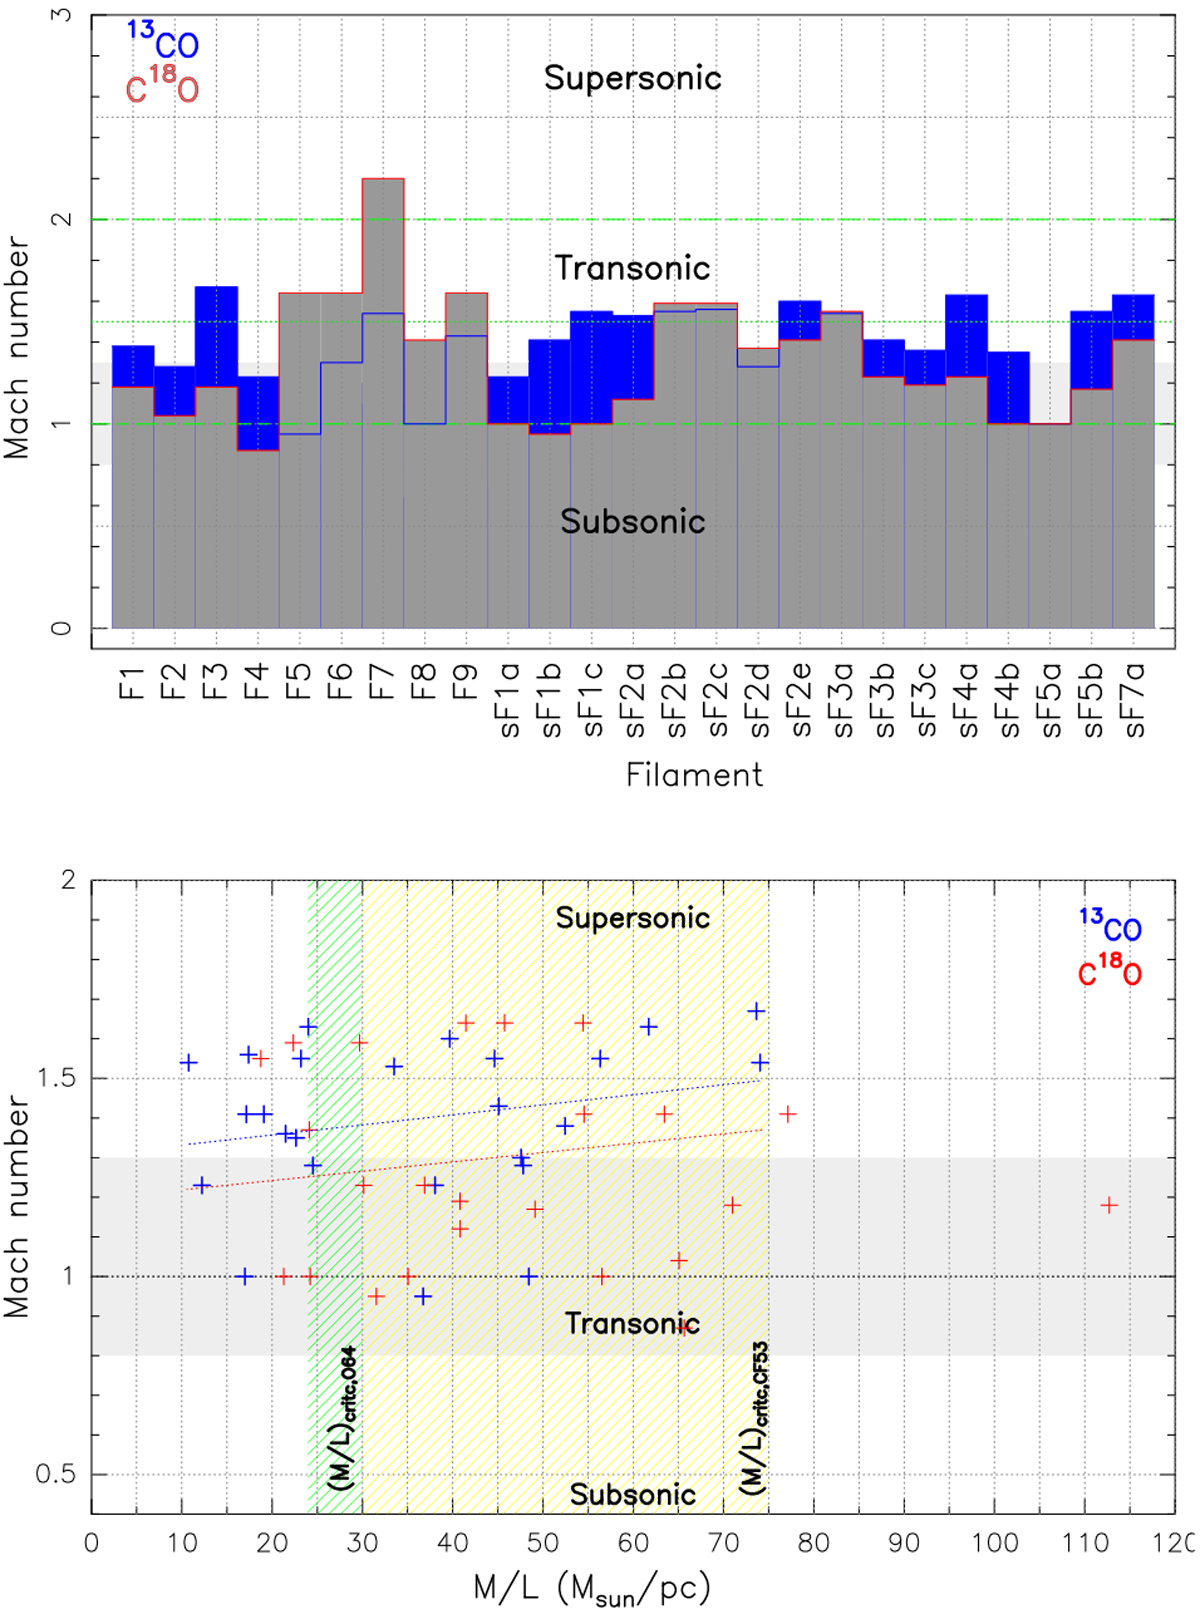
Top: distribution of the Mach number calculated from the 13CO (blue) and C18O (red-gray) velocity dispersion. Bottom: relation between the Mach number and the observed
M∕L. The green area indicates the range of the ![]() values and the yellow area indicates the range of the
values and the yellow area indicates the range of the ![]() values. A linear fit is indicated by the blue and red dotted lines.
values. A linear fit is indicated by the blue and red dotted lines.
Current usage metrics show cumulative count of Article Views (full-text article views including HTML views, PDF and ePub downloads, according to the available data) and Abstracts Views on Vision4Press platform.
Data correspond to usage on the plateform after 2015. The current usage metrics is available 48-96 hours after online publication and is updated daily on week days.
Initial download of the metrics may take a while.