Free Access
Fig. 8
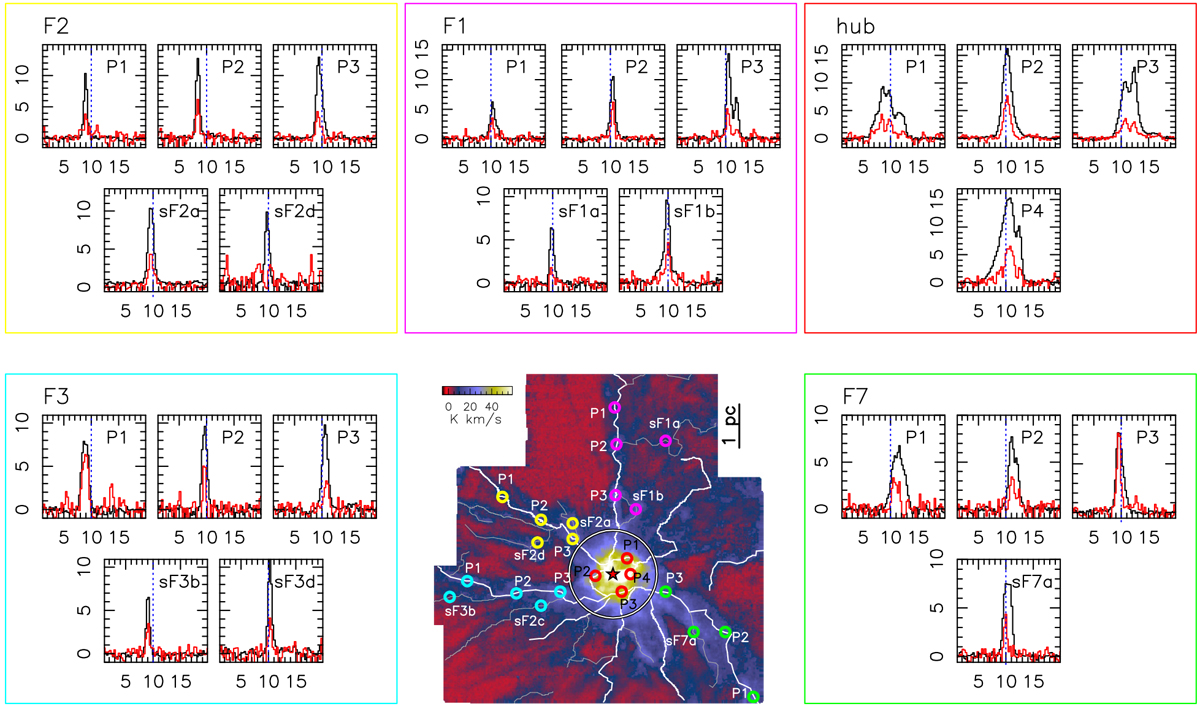
Averaged spectra of the molecules of 13CO (black) and C18O (red) at different positions toward the hub (red box), and the filaments and secondary filaments F1 (pink box), F2 (yellow box), F3 (light-blue box) and, F7 (green box). The positions corresponding to each spectrum are indicated in the central bottom panel.
Current usage metrics show cumulative count of Article Views (full-text article views including HTML views, PDF and ePub downloads, according to the available data) and Abstracts Views on Vision4Press platform.
Data correspond to usage on the plateform after 2015. The current usage metrics is available 48-96 hours after online publication and is updated daily on week days.
Initial download of the metrics may take a while.