Fig. 7
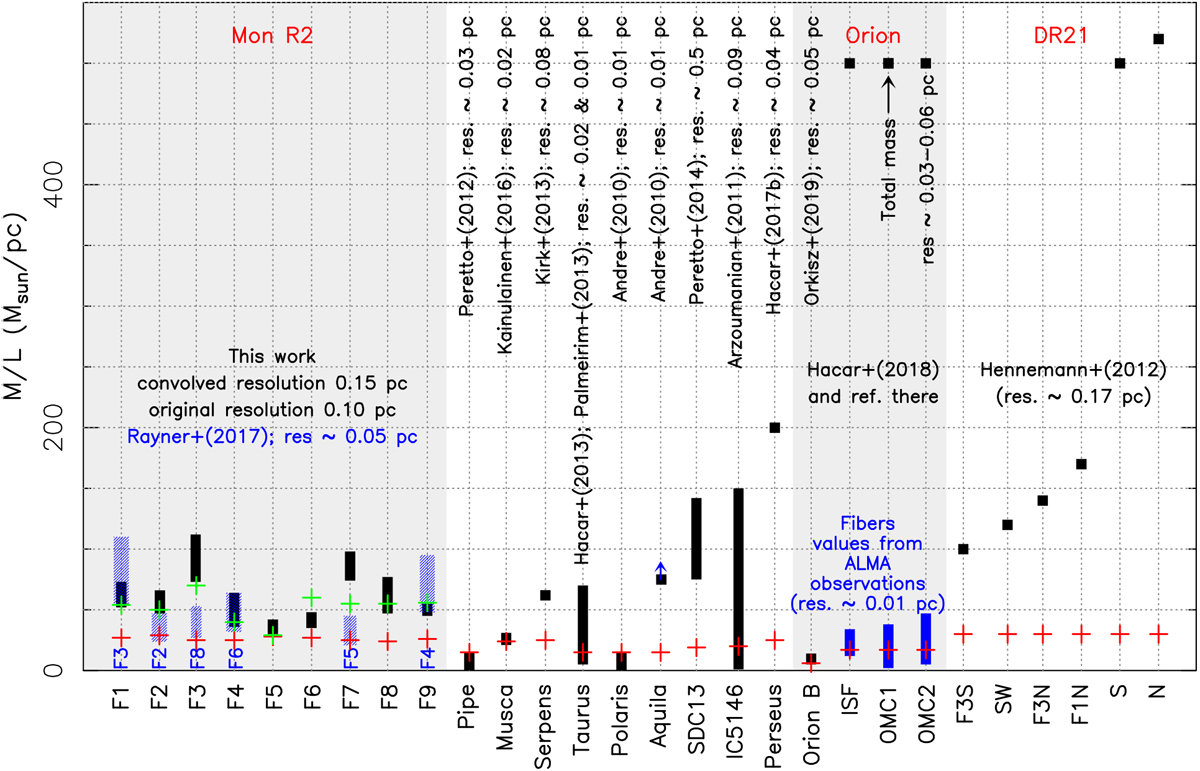
Comparison of the observed M∕L for the filaments F1 to F9 with different low-mass and high-mass star-forming regions. The gray area on the left present the Mon R2 range of values obtained in this work (in black) and by Rayner et al. (2017) (in blue). The gray area located toward the right of the plot present the Orion values. The blue solid bars at the Orion band indicate the M∕L range found in the fibers within each filament. The black bars present the total filament M∕L reported by Bally et al. (1987) and Johnstone & Bally (1999). The red crosses indicate the value of the
![]() for each region, while the green ones indicate the value of the
for each region, while the green ones indicate the value of the ![]() for each filament in Mon R2. The plot indicates the resolution used in each work to obtain the observational M∕L.
for each filament in Mon R2. The plot indicates the resolution used in each work to obtain the observational M∕L.
Current usage metrics show cumulative count of Article Views (full-text article views including HTML views, PDF and ePub downloads, according to the available data) and Abstracts Views on Vision4Press platform.
Data correspond to usage on the plateform after 2015. The current usage metrics is available 48-96 hours after online publication and is updated daily on week days.
Initial download of the metrics may take a while.