Fig. 5
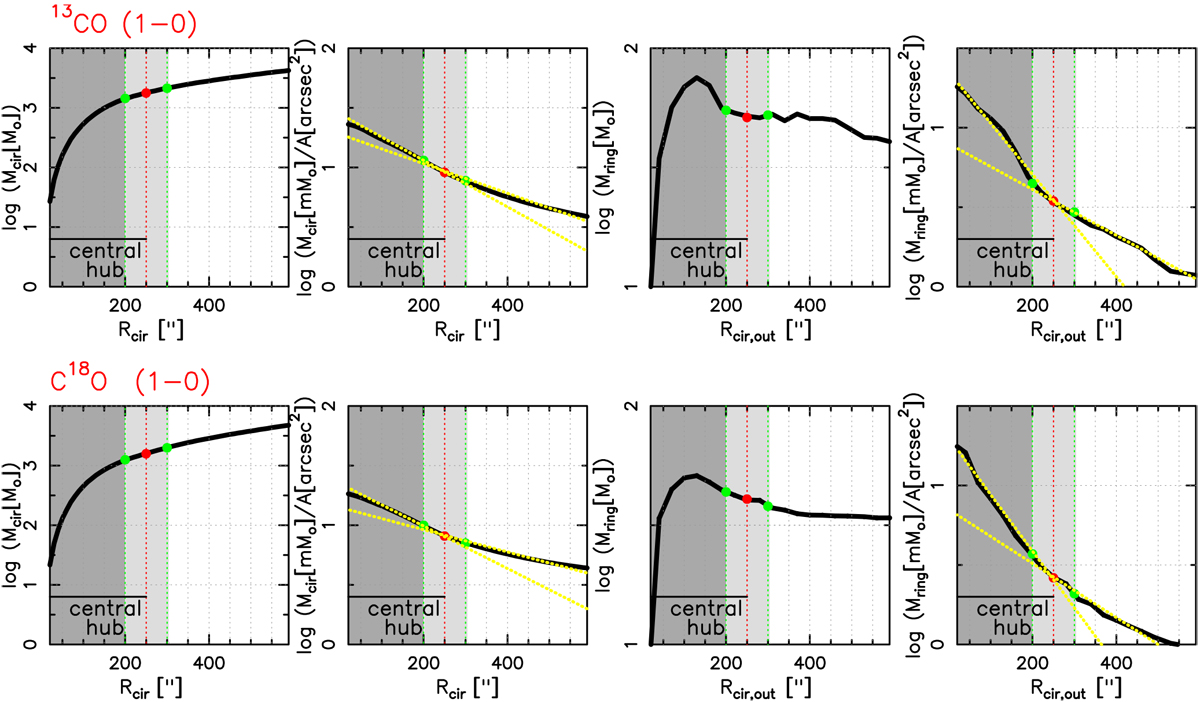
Azimuthally averaged mass and surface density derived from the 13CO (top) and C18O (bottom) column density maps. From left to right: each column shows (i) radially integratedmass, (ii) radially integrated mass divided by the area of the circle with radius Rcir (i.e., radially integrated surface density), (iii) concentric annular mass, (iv) concentric annular surface density. The radially integrated mass and surface density were calculated within circles of radius Rcir centered on IRS 1 from R = 25″ (~ 0.1 pc) to R = 600″ (~ 2.4 pc). The concentric annular mass and surface density were calculated within concentric rings of radius Rring =Rcir,out − Rcir,in = 36″ (corresponding to the Herschel beam size). In order to do a direct comparison of the profiles, the x-axis in the concentric annular mass and surface density profiles correspond to Rcir,out. The yellow dotted lines indicate the different slopes in the surface density profiles. The light gray zone indicates the transition between the hub and the filaments, from 200′′ to 300′′. The dark gray area marks the central hub with Rhub = 250” = 1 pc.
Current usage metrics show cumulative count of Article Views (full-text article views including HTML views, PDF and ePub downloads, according to the available data) and Abstracts Views on Vision4Press platform.
Data correspond to usage on the plateform after 2015. The current usage metrics is available 48-96 hours after online publication and is updated daily on week days.
Initial download of the metrics may take a while.