Fig. 4
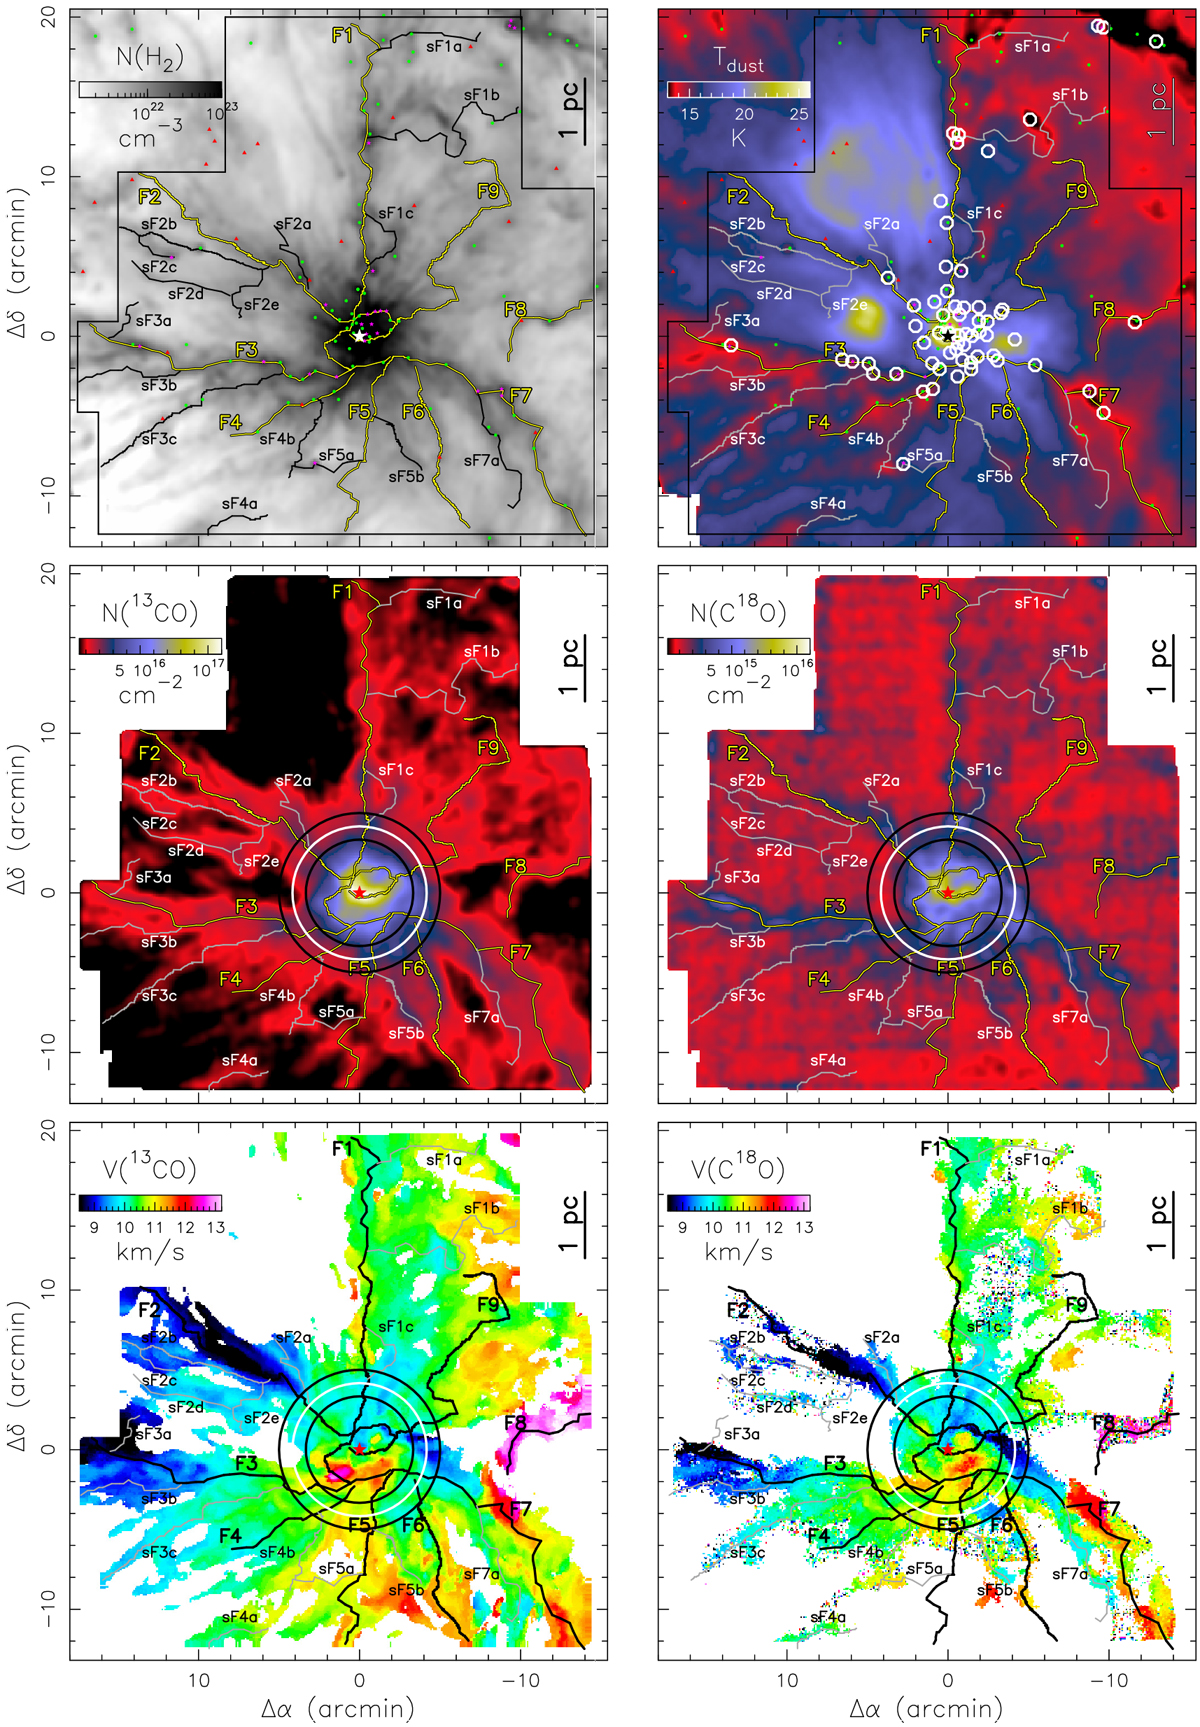
Top panels: H2 column density (left) and dust temperature (right) maps from Herschel (Didelon et al. 2015). Middle panels: 13CO (left) and C18O (right) column density maps. Bottom panels: velocity centroid for 13CO (left) and C18O (right). The “skeleton” of identified filaments are marked with solid white, black, or yellow lines. The black and white circles correspond to the radii at 200′′, 250′′, and 300′′ (transition between thehub and the filaments, see Fig. 5). The white circles in the top right panel shows sources identified bySokol et al. (2019); the colored symbols show the sources identified by Rayner et al. (2017).
Current usage metrics show cumulative count of Article Views (full-text article views including HTML views, PDF and ePub downloads, according to the available data) and Abstracts Views on Vision4Press platform.
Data correspond to usage on the plateform after 2015. The current usage metrics is available 48-96 hours after online publication and is updated daily on week days.
Initial download of the metrics may take a while.