Fig. B.4
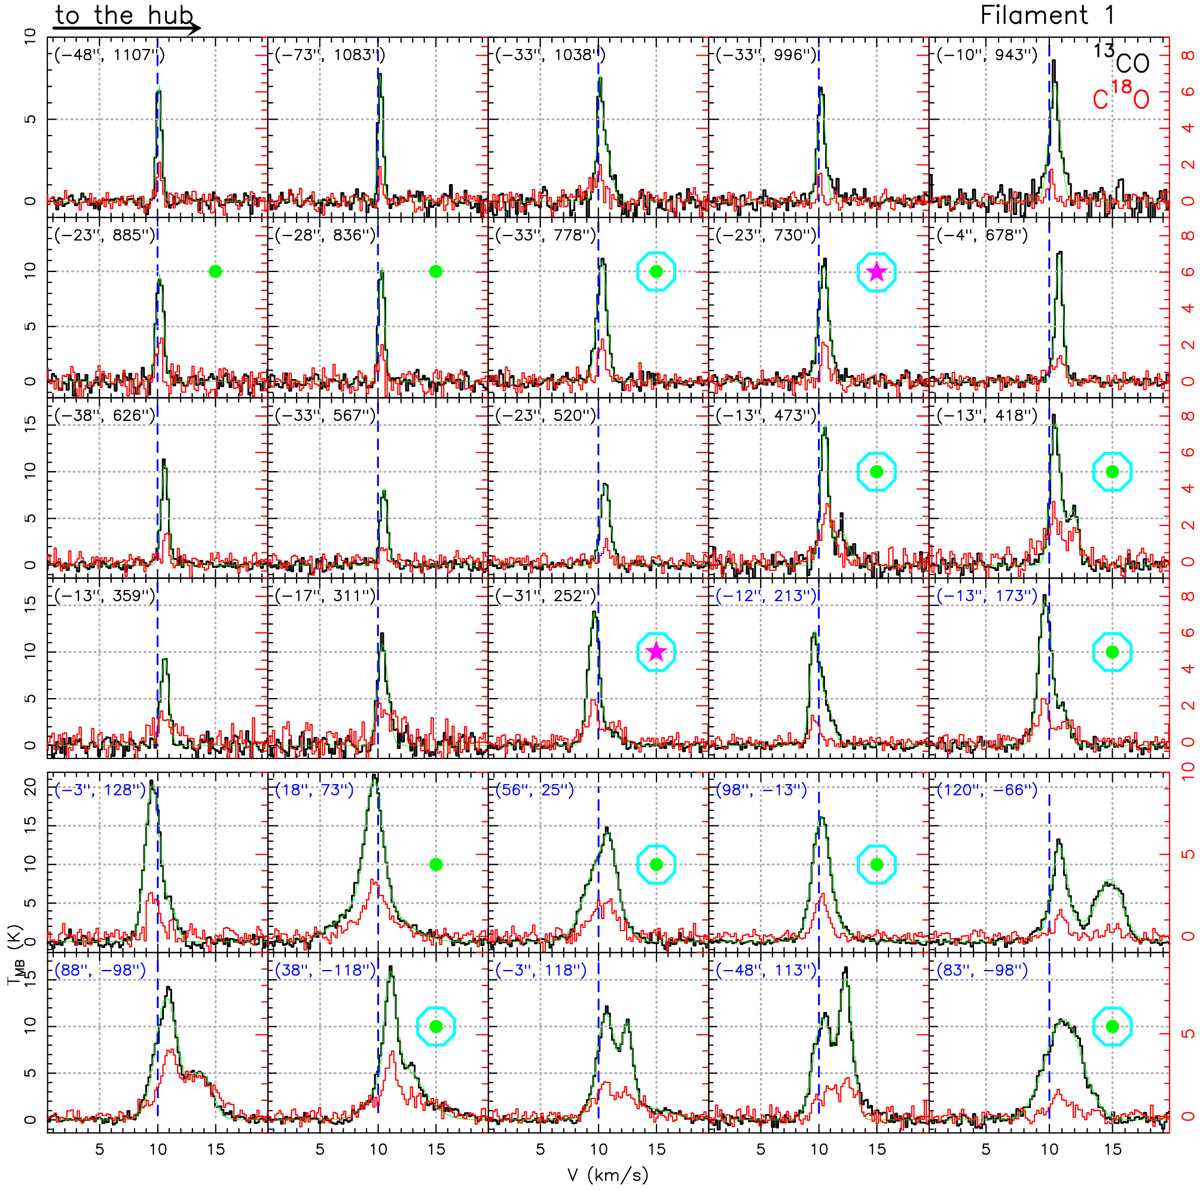
Spectra of the 13CO (black) and C18O (red) lines. These spectra were extracted along skeleton of the Filament 1. The green solid lines correspond to the Gaussian fits listed in Table B.6. The blue dashed line shows the velocity of 10 km s−1. The corresponding positions for each spectra are indicated in the top left corner of the panels. The positions corresponding to the filaments outside the hub are labeled in black. The positions corresponding to spectra inside the central hub (Rhub = 250″) are in blue. The colored symbols in the panels indicate the positions corresponding with sources identified by Rayner et al. (2017). The pink stars correspond to protostars, the green circles to bound cores, and the red triangles to unbound clumps. The large aqua circles correspond to the sources identified by Sokol et al. (2019). Figures B.5–B.12 show the spectra along the Filaments 2–9 skeleton. Figures B.13 and B.14 show the spectra along the secondary filament skeletons.
Current usage metrics show cumulative count of Article Views (full-text article views including HTML views, PDF and ePub downloads, according to the available data) and Abstracts Views on Vision4Press platform.
Data correspond to usage on the plateform after 2015. The current usage metrics is available 48-96 hours after online publication and is updated daily on week days.
Initial download of the metrics may take a while.