Free Access
Fig. B.3
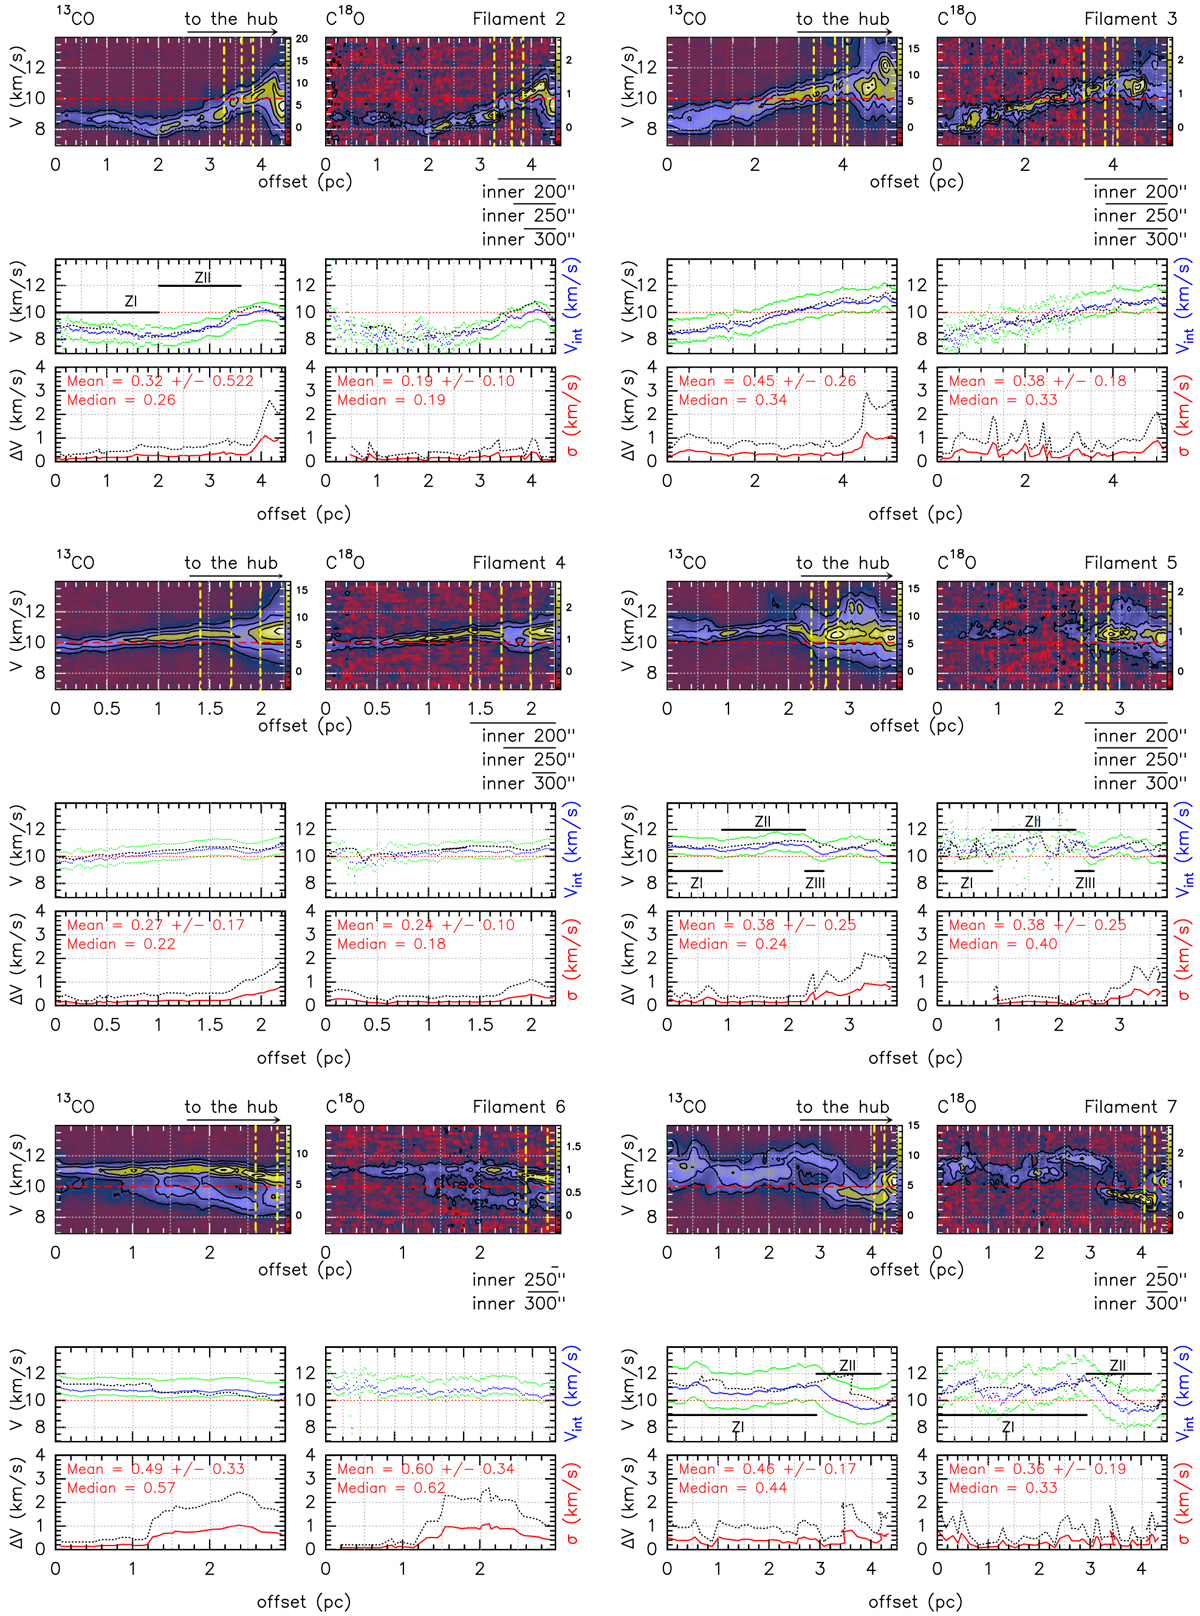
Position-velocity diagrams along the skeletons of the main and secondary filaments. For each filament there is a set of six plots showing the results for 13CO (left) and C18O (right). The description of the panels and symbols can be found in Fig. 10.
Current usage metrics show cumulative count of Article Views (full-text article views including HTML views, PDF and ePub downloads, according to the available data) and Abstracts Views on Vision4Press platform.
Data correspond to usage on the plateform after 2015. The current usage metrics is available 48-96 hours after online publication and is updated daily on week days.
Initial download of the metrics may take a while.