Fig. B.2
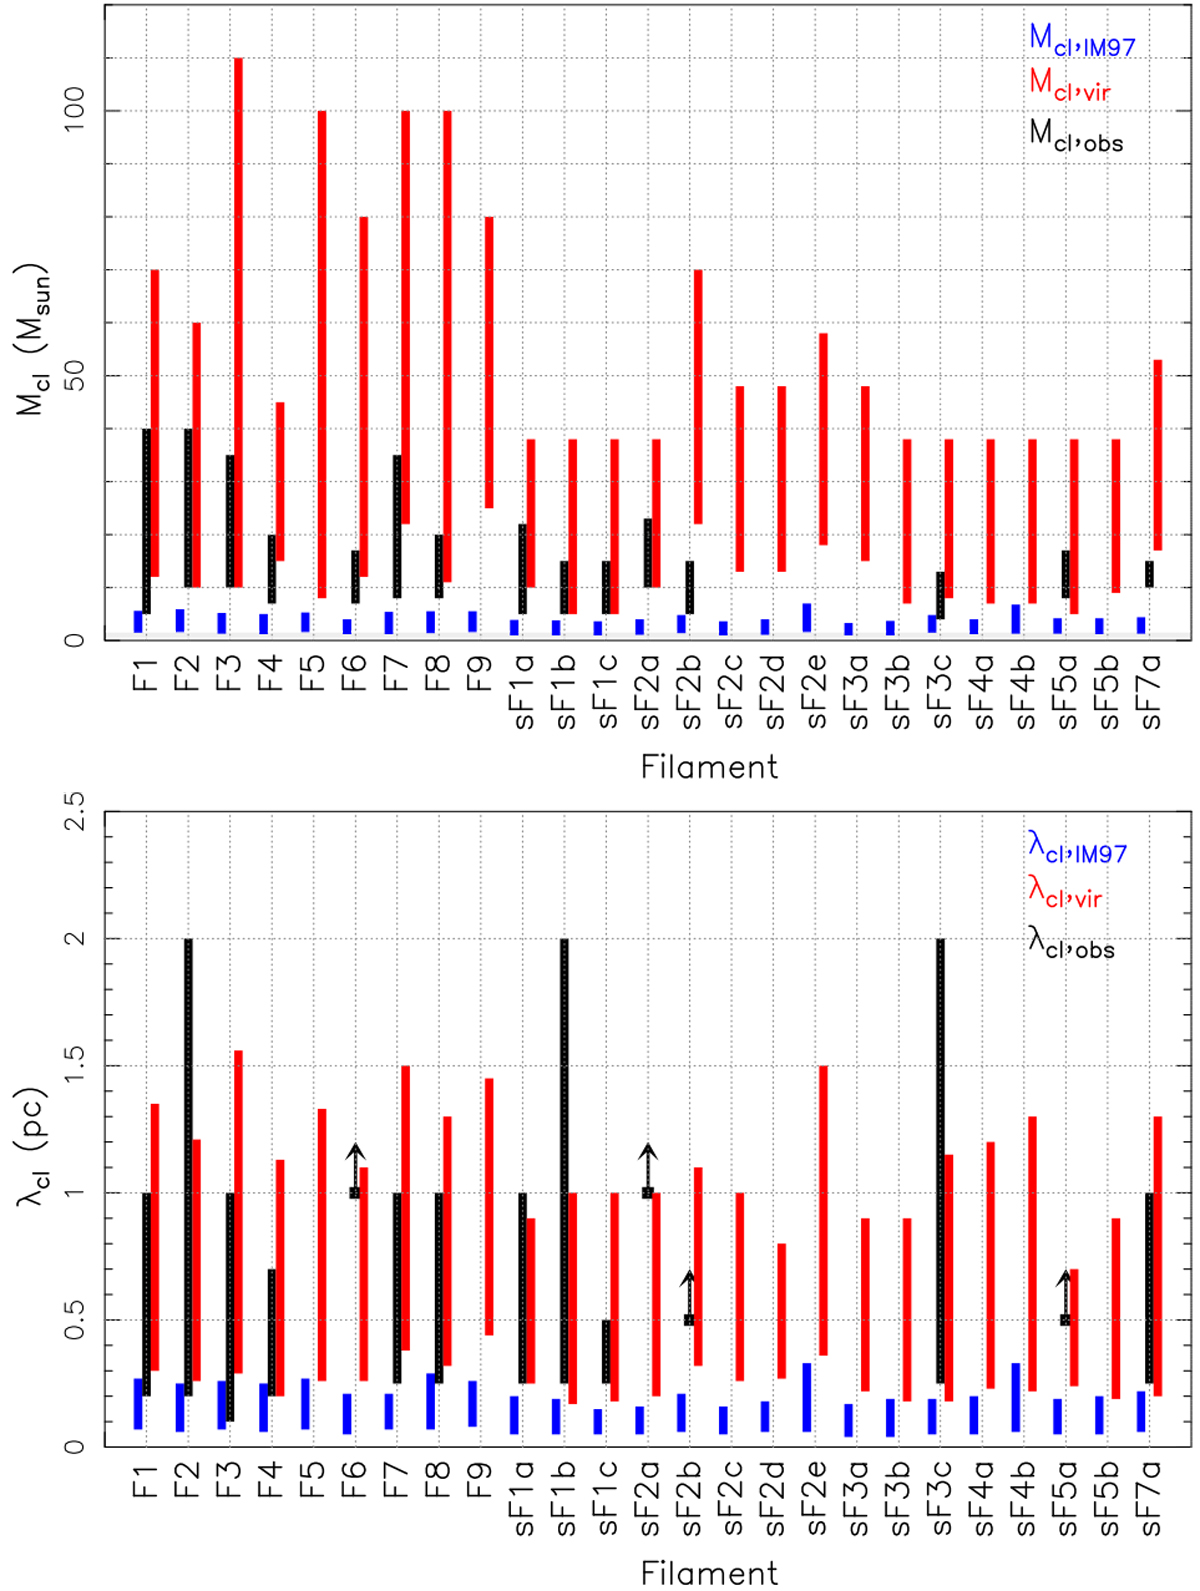
Masses (top panel) and separation (bottom panel) of clumps within main and secondary filaments. The observed values are marked in black, and the ranges are set from the minimum and maximum values obtained from the different molecular tracers (see Tables B.1–B.4). Theoretical values are marked in blue (following the O64 model) and in red (following the C51 model), see Sect. 4.3.
Current usage metrics show cumulative count of Article Views (full-text article views including HTML views, PDF and ePub downloads, according to the available data) and Abstracts Views on Vision4Press platform.
Data correspond to usage on the plateform after 2015. The current usage metrics is available 48-96 hours after online publication and is updated daily on week days.
Initial download of the metrics may take a while.