Fig. 14
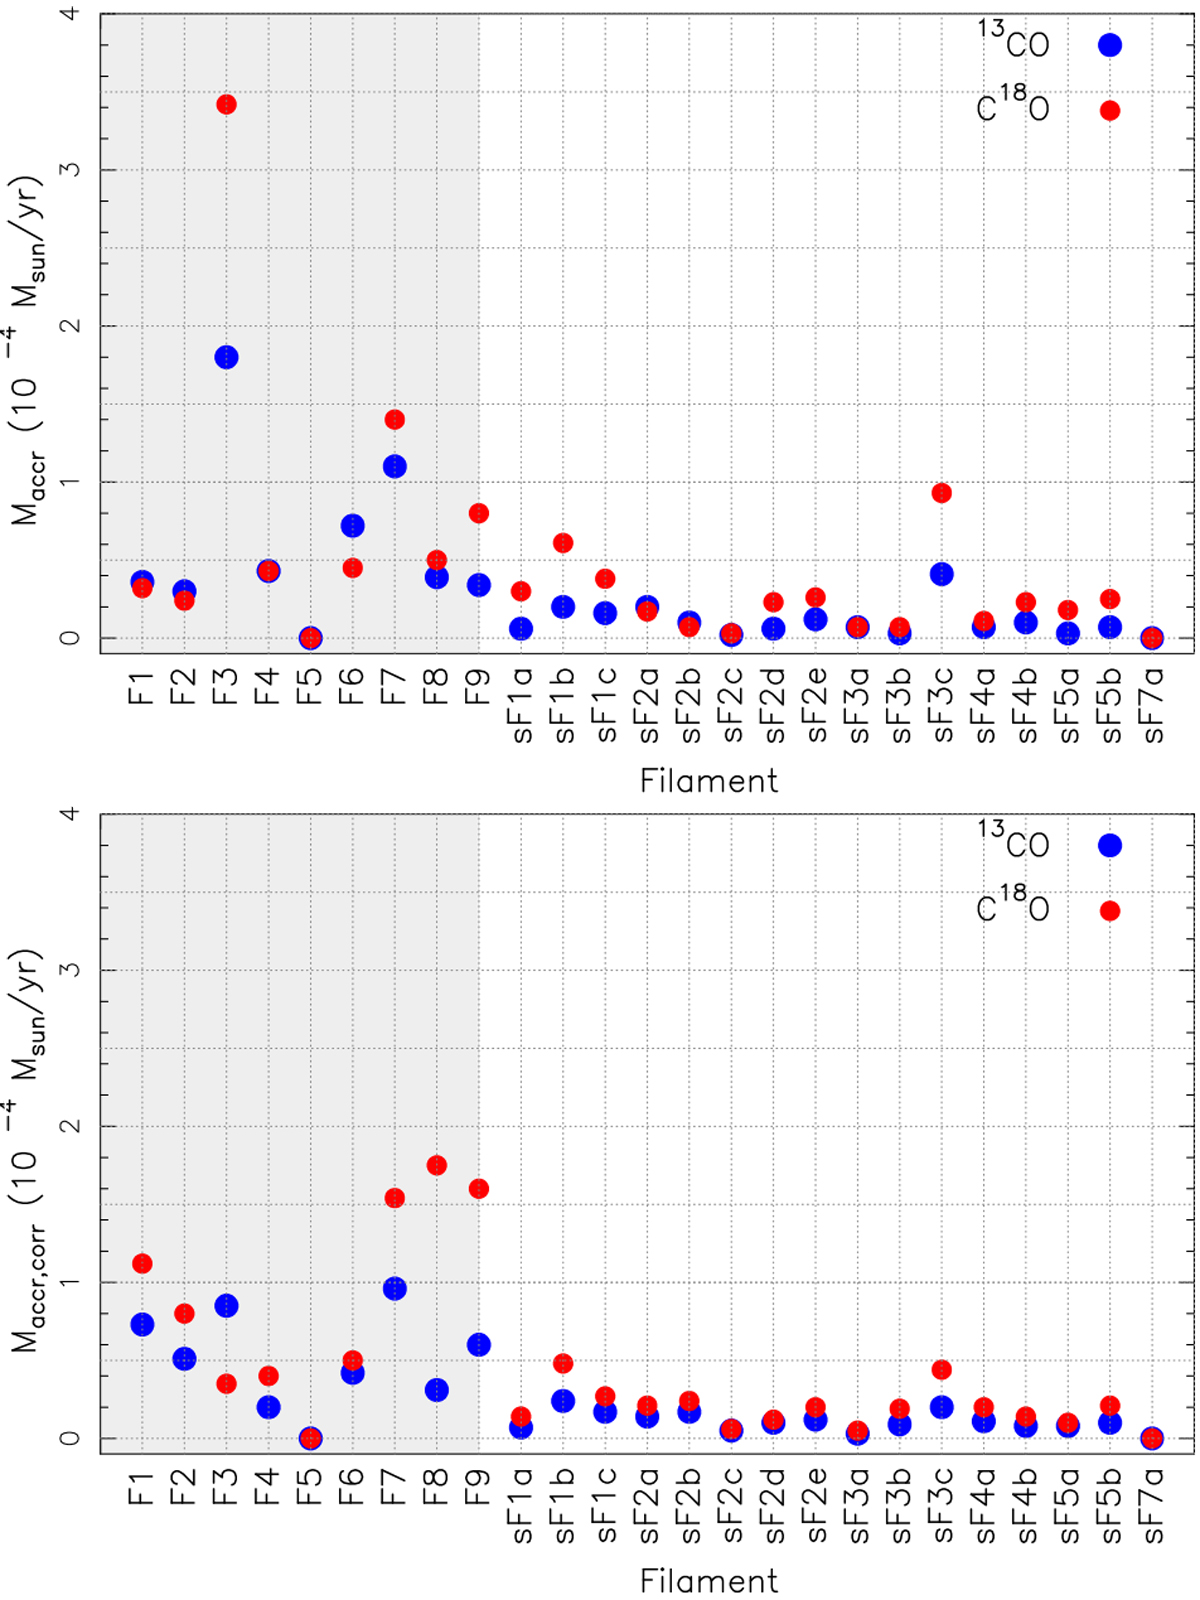
Mass accretion rate along the main and secondary filament considering an inclination of α = 45° (top) and the inclination listed in Table B.5 (bottom). The blue dots correspond to the values calculated from the 13CO parameters (M and ∇V∥obs) and the red ones correspond to the values calculated using the C18O parameters. The gray zone in the plots indicate the values corresponding to the main filaments.
Current usage metrics show cumulative count of Article Views (full-text article views including HTML views, PDF and ePub downloads, according to the available data) and Abstracts Views on Vision4Press platform.
Data correspond to usage on the plateform after 2015. The current usage metrics is available 48-96 hours after online publication and is updated daily on week days.
Initial download of the metrics may take a while.