Fig. 13
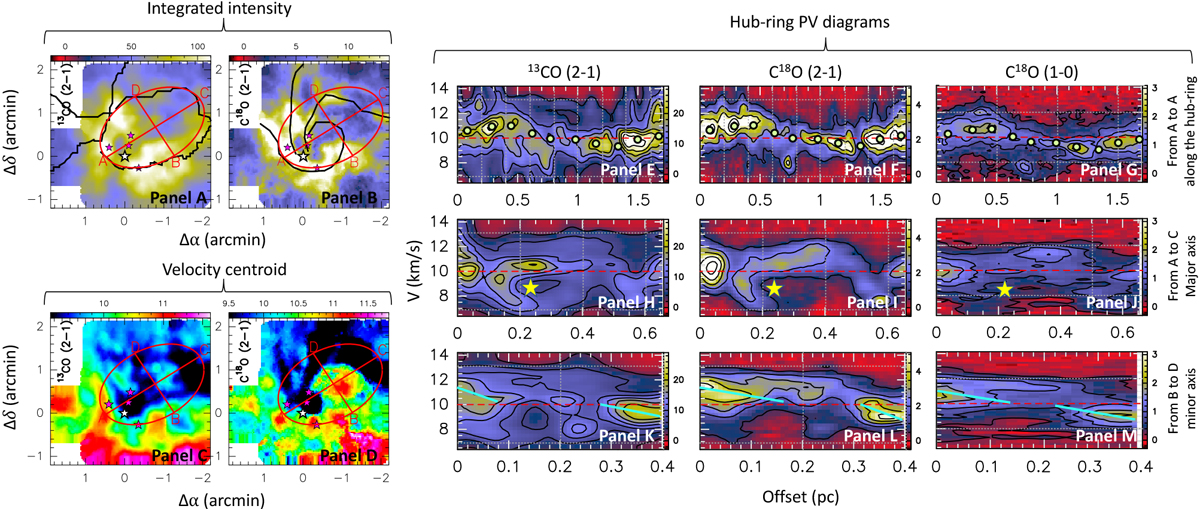
Integrated intensity (panels A and B) and velocity centroid (panels C and D) maps of the C18O and 13CO (2 →1) lines. The red ellipse marks the position of the hub-ring. Panels E–G: PV diagrams clockwise along the hub-ring (starting at the point A of the ellipse) for the 13CO (2 →1), C18O (2 →1) and C18O (1 →0) lines. Panels H and J: PV diagrams along the major axis (from point A to point C). Finally, panels K and M: PV diagrams along the minor axis (from point B to point D). The green dots in panels E–G indicate the velocities associated with the most intense emission along the ellipse, tracing the sinusoidal pattern. The yellow stars in panels H–J show the position of the cluster along the major axis. Finally, the cyan lines in panels K–M mark the strongest velocity gradients along the minor axis.
Current usage metrics show cumulative count of Article Views (full-text article views including HTML views, PDF and ePub downloads, according to the available data) and Abstracts Views on Vision4Press platform.
Data correspond to usage on the plateform after 2015. The current usage metrics is available 48-96 hours after online publication and is updated daily on week days.
Initial download of the metrics may take a while.