Fig. 12
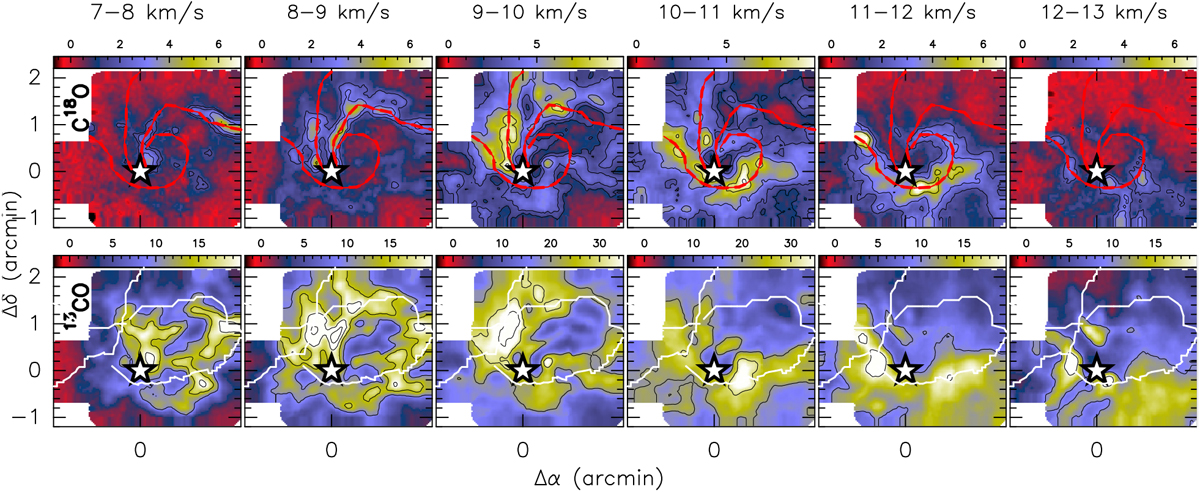
Integrated emission maps in ranges of 1 km s−1 for the C18O 2 →1 line (top panels) and 13CO 2 →1 line (bottom panels). The red lines in the top panels depict the brightest features of the C18O emission, and mark the possible path that the gas follows to reach the stellar cluster, indicated with a white star. The white lines in the bottom panels mark the “skeletons” of the filaments identified by DisPerSE in the 13CO and C18O 1 →0 maps.
Current usage metrics show cumulative count of Article Views (full-text article views including HTML views, PDF and ePub downloads, according to the available data) and Abstracts Views on Vision4Press platform.
Data correspond to usage on the plateform after 2015. The current usage metrics is available 48-96 hours after online publication and is updated daily on week days.
Initial download of the metrics may take a while.