Fig. 11
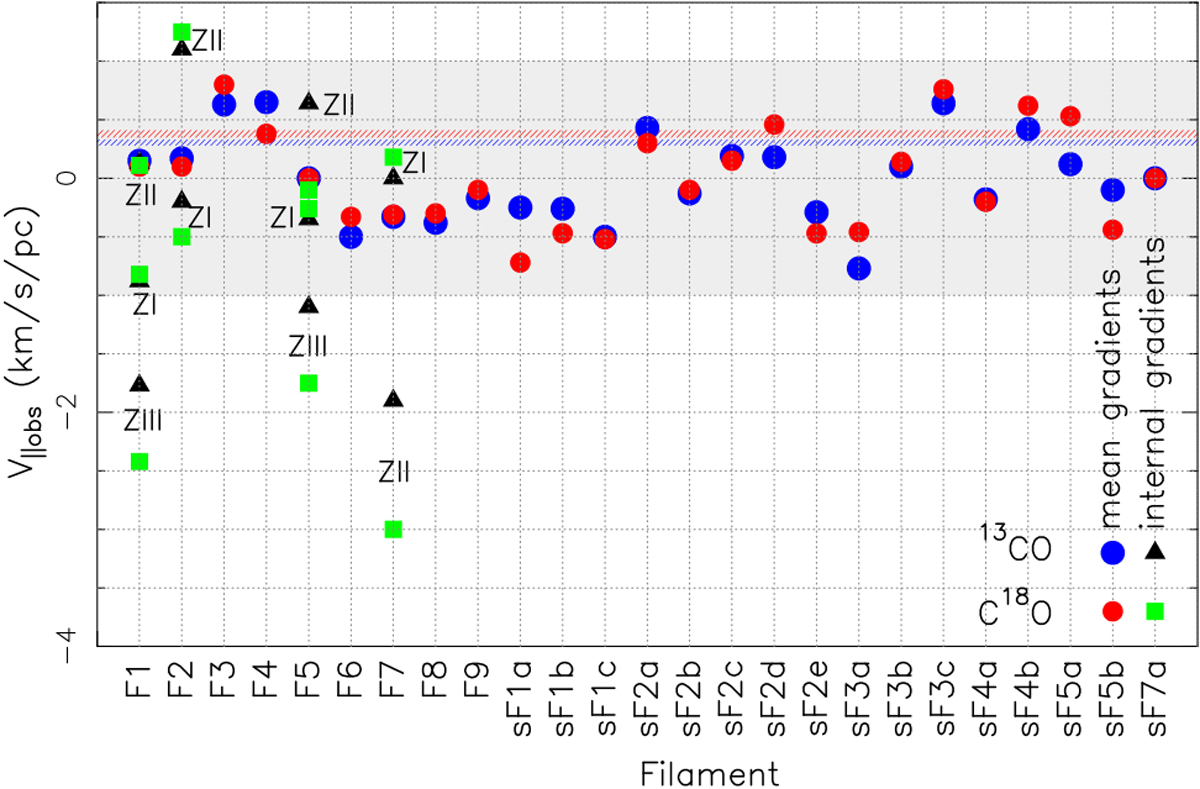
Distribution of the velocity gradients. The blue dots correspond to the values calculated from the 13CO data and thered dots to the values calculated using the C18O data. Theblue and red dotted lines indicates the average values of the gradients. The black triangles (13CO) and green squares (C18O) correspond to the different gradients calculated along the filaments F1, F2, F5, and F7. The Zones (ZI, ZII, and ZIII) labeled in those filaments correspond to those indicated in their respective velocity diagrams (e.g., Fig. 10).
Current usage metrics show cumulative count of Article Views (full-text article views including HTML views, PDF and ePub downloads, according to the available data) and Abstracts Views on Vision4Press platform.
Data correspond to usage on the plateform after 2015. The current usage metrics is available 48-96 hours after online publication and is updated daily on week days.
Initial download of the metrics may take a while.