Fig. 1
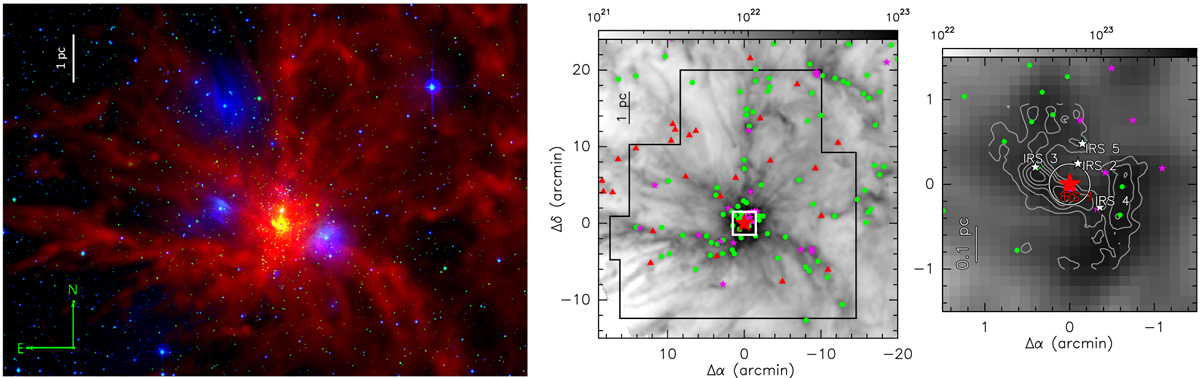
Left: three-color image of the Mon R2 cluster-forming hub-filaments system. Red: H2 column density map derived from Herschel SPIRE and PACS observations (Didelon et al. 2015), green: 1.65 μm band of the Two Micron All Sky Survey (Skrutskie et al. 2006), and blue: 560 nm band of the Digitalized Sky Survey (Lasker et al. 1990). Center: Herschel H2 column density (in cm−2, Didelon et al. 2015). The black polygon shows the area surveyed with the IRAM-30 m telescope, while the white box corresponds to the inner 0.7 pc × 0.7 pc around the central hub and zoomed in the right panel. Right: Herschel H2 column density (in cm−2) of the central hub of Mon R2. Gray contours show the H13CO+ (3 →2) emission tracing the high-density molecular gas (Treviño-Morales et al. 2014). The red star gives the position of IRS 1 (with coordinates α(J2000) = 06h 07m 46.2s, δ(J2000) = − 06°23′08.3″). White stars indicate the positions of infrared sources. The white circle indicates the beam size of the IRAM-30 m telescope at 100 GHz(see Sect. 2). The colored symbols are the sources identified by Rayner et al. (2017): pink stars are protostars, green circles are bound clumps, and red triangles are unbound clumps.
Current usage metrics show cumulative count of Article Views (full-text article views including HTML views, PDF and ePub downloads, according to the available data) and Abstracts Views on Vision4Press platform.
Data correspond to usage on the plateform after 2015. The current usage metrics is available 48-96 hours after online publication and is updated daily on week days.
Initial download of the metrics may take a while.