Fig. 8.
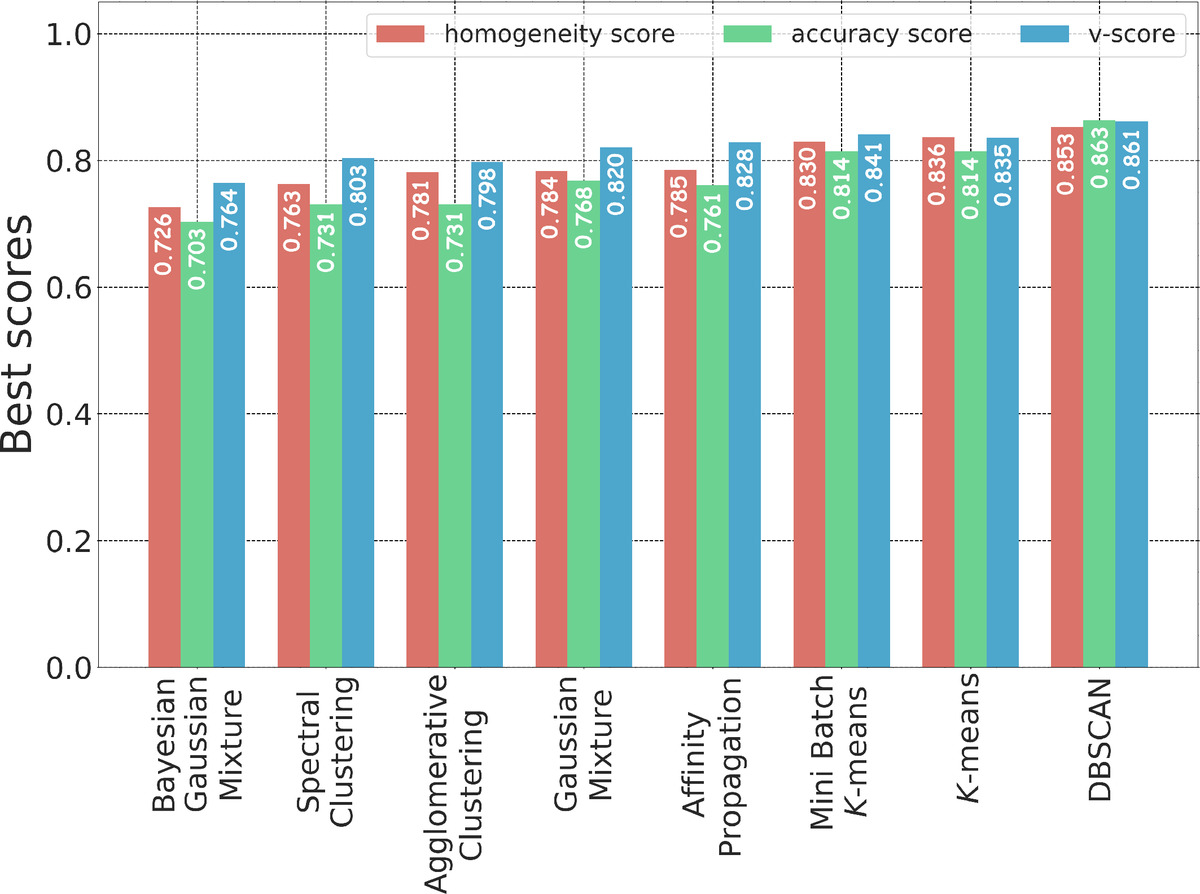
Best result for each of the algorithms we tested without constraining the number of clusters, represented by bars. Different colors are used to distinguish among the metrics, as shown in the legend. In groups of three bars, the leftmost bar represents the homogeneity score, the bar in the middle represents the accuracy score, and the rightmost bar represents the v-measure score. The actual values are given in each bar.
Current usage metrics show cumulative count of Article Views (full-text article views including HTML views, PDF and ePub downloads, according to the available data) and Abstracts Views on Vision4Press platform.
Data correspond to usage on the plateform after 2015. The current usage metrics is available 48-96 hours after online publication and is updated daily on week days.
Initial download of the metrics may take a while.