Fig. 7.
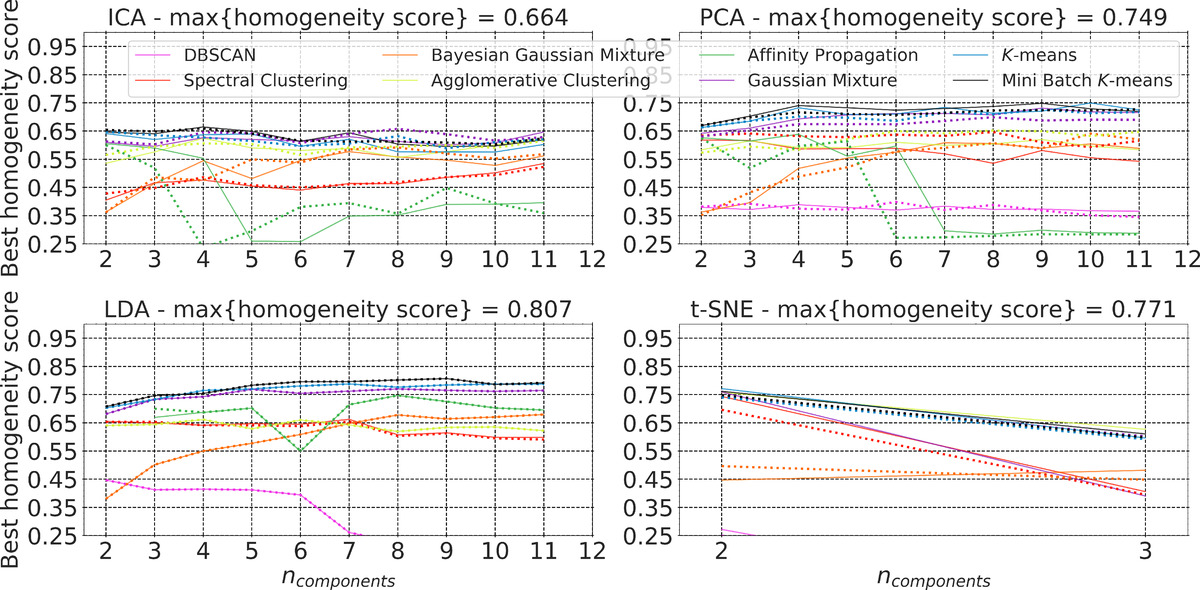
Best homogeneity score. This varies for each of the dimensionality reduction models with the variation of the number of components. The labels at the top of each panel indicate the dimensionality reduction algorithm. Different colors are used for each clustering algorithm. Solid lines present the results obtained when we applied the robust scaler, and dotted lines show the results for the standard scaler.
Current usage metrics show cumulative count of Article Views (full-text article views including HTML views, PDF and ePub downloads, according to the available data) and Abstracts Views on Vision4Press platform.
Data correspond to usage on the plateform after 2015. The current usage metrics is available 48-96 hours after online publication and is updated daily on week days.
Initial download of the metrics may take a while.