Fig. 6.
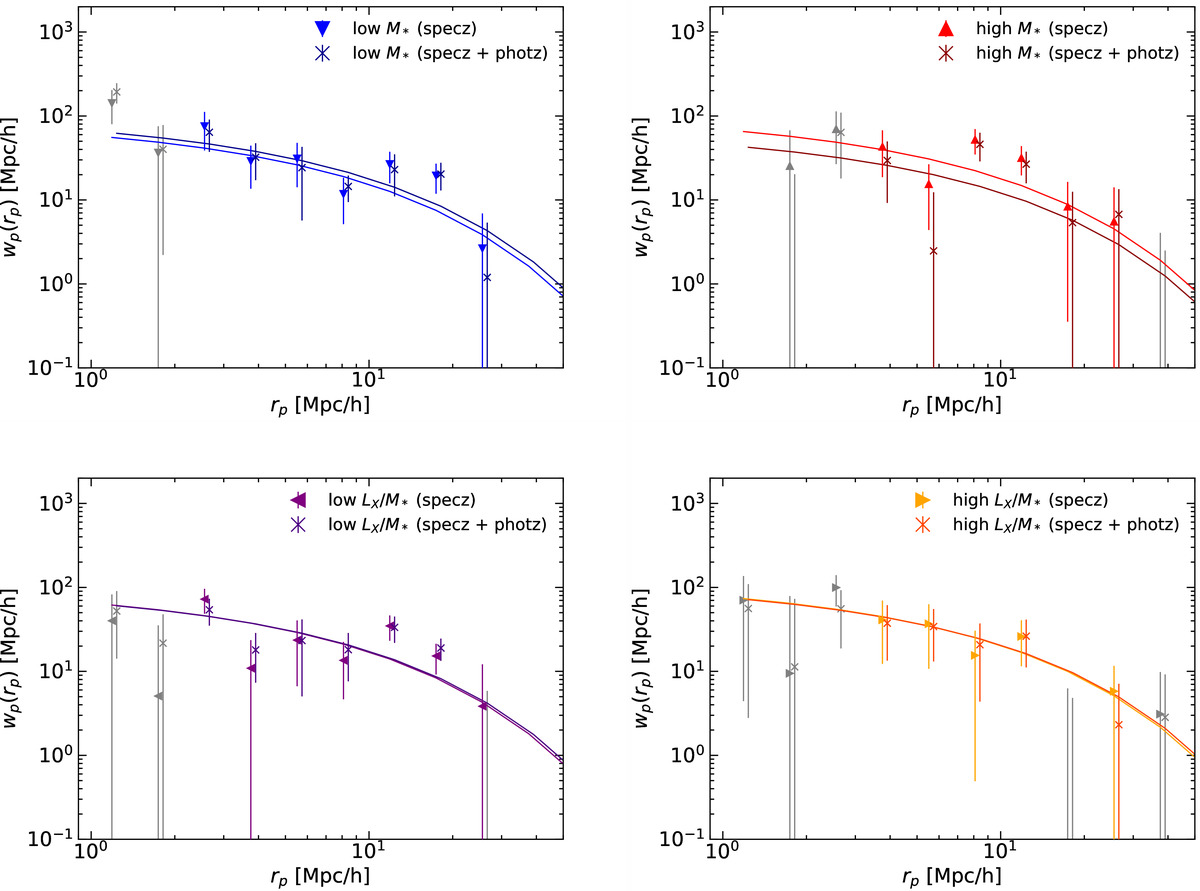
Effect of including photometric redshifts as Pdfs in estimation of projected 2PCF. Triangles with different orientation mark the different AGN subsamples with spectroscopic redshifts only. Crosses show the projected 2PCF signal when including photometric redshifts as Pdfs. The lines show the squared best-fit bias times the projected DM correlation function. The bins have been slightly offset in the rp direction for clarity.
Current usage metrics show cumulative count of Article Views (full-text article views including HTML views, PDF and ePub downloads, according to the available data) and Abstracts Views on Vision4Press platform.
Data correspond to usage on the plateform after 2015. The current usage metrics is available 48-96 hours after online publication and is updated daily on week days.
Initial download of the metrics may take a while.