Fig. 5.
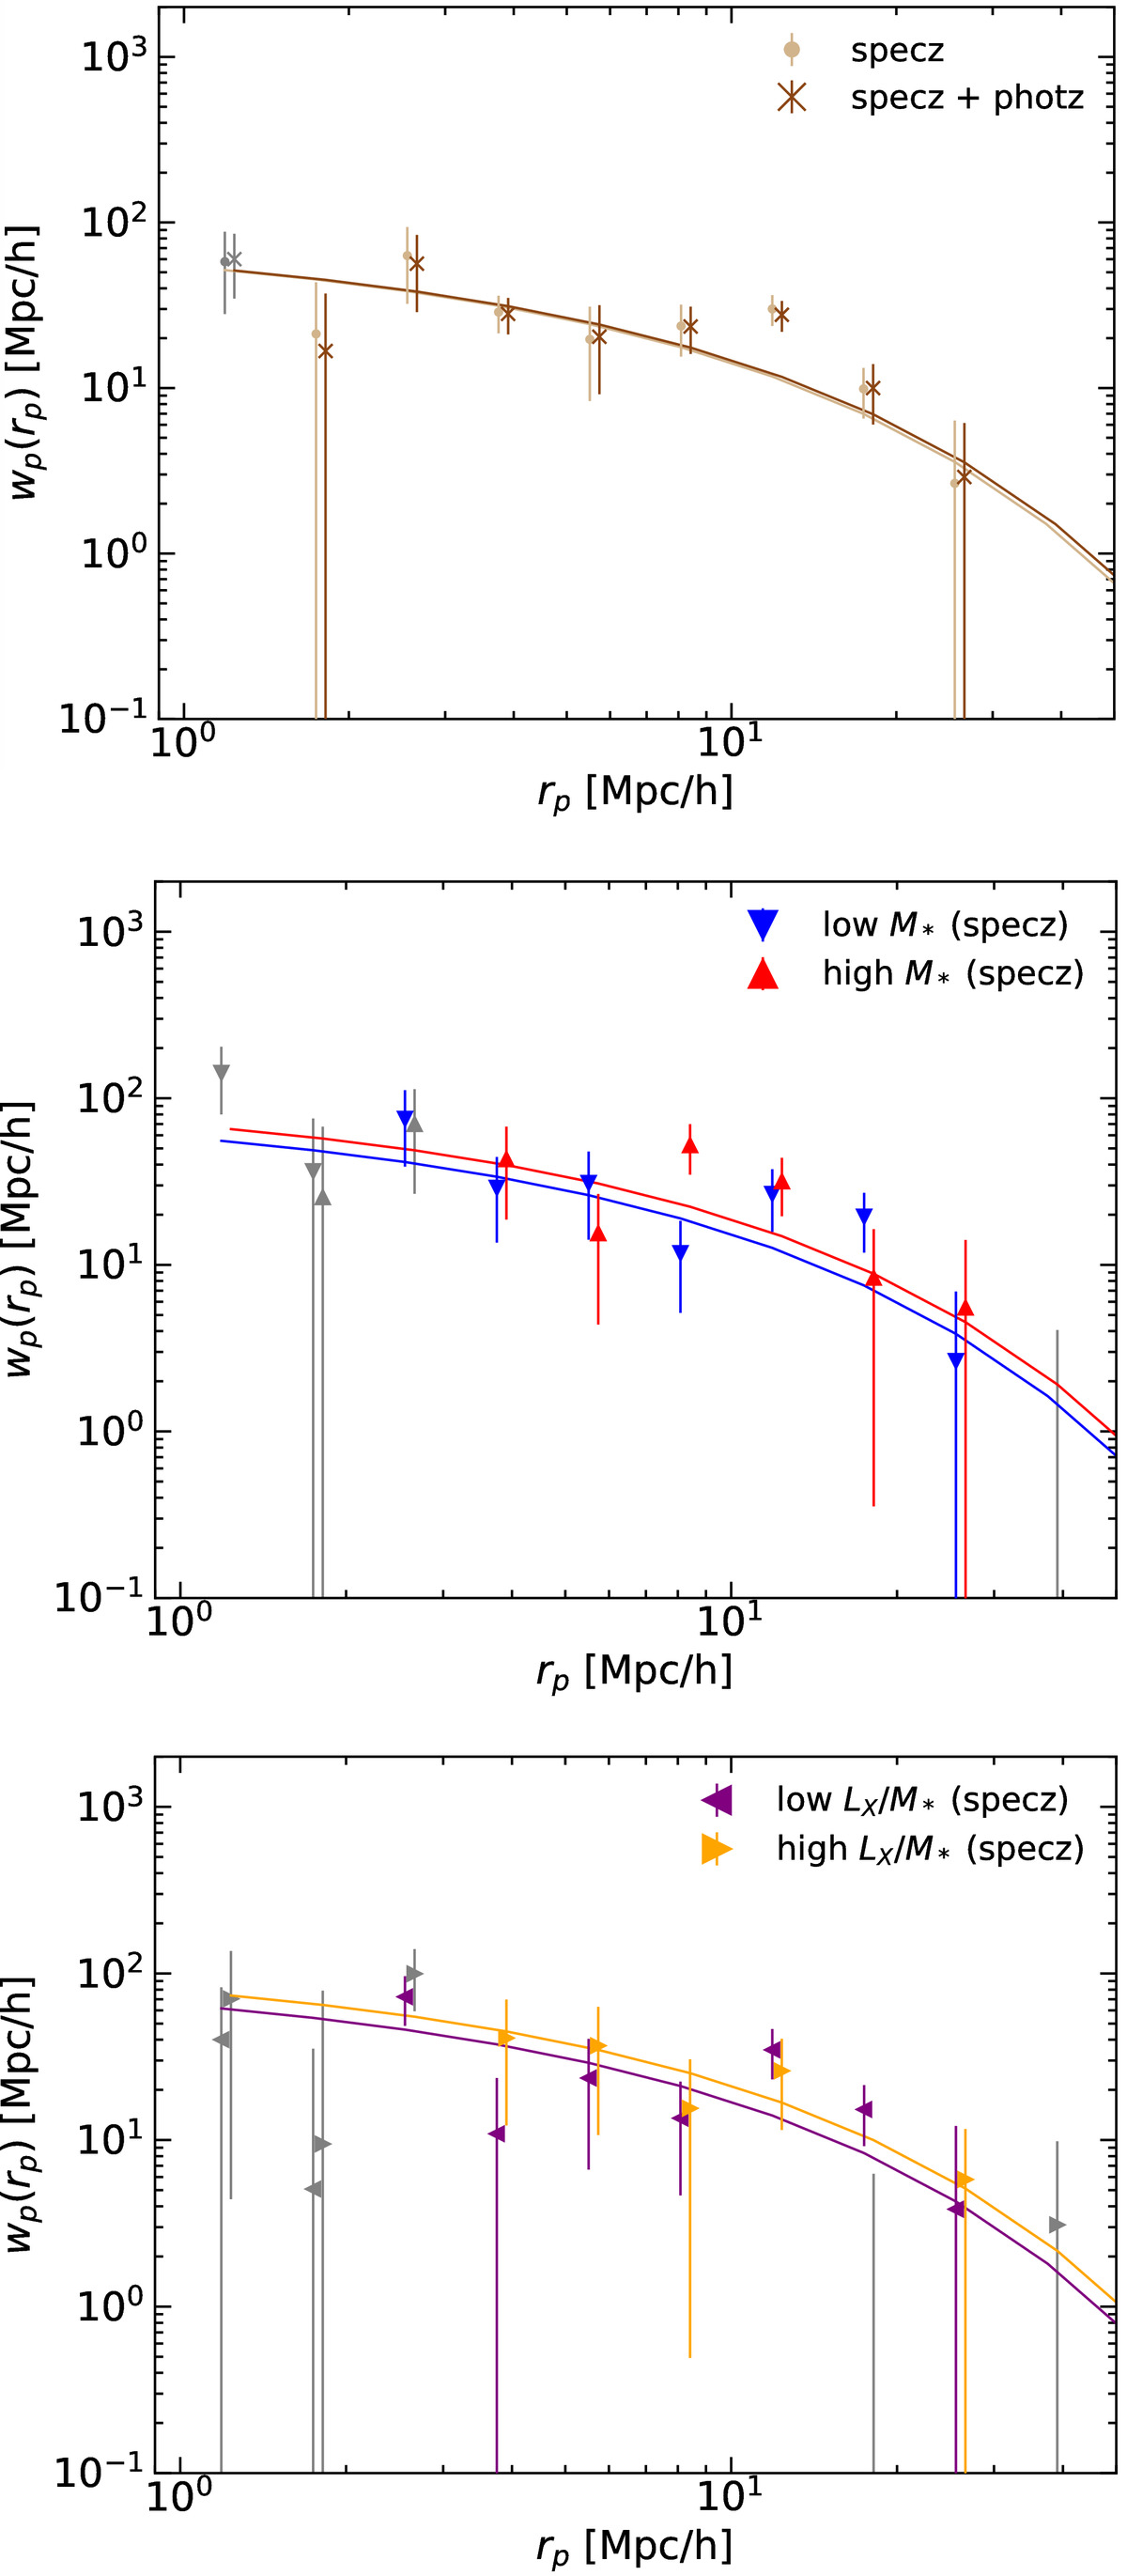
Measured projected 2PCF for full sample and AGN subsamples. The errorbars correspond to 1σ estimated via the bootstrap method. The solid lines show the squared best-fit bias times the projected DM correlation function estimated at the mean redshift of the particular sample. The gray datapoints are not used in the fit due to a low number of pairs. The excess correlation at rp ∼ 15 h−1 Mpc is likely driven by large structure in the COSMOS field.
Current usage metrics show cumulative count of Article Views (full-text article views including HTML views, PDF and ePub downloads, according to the available data) and Abstracts Views on Vision4Press platform.
Data correspond to usage on the plateform after 2015. The current usage metrics is available 48-96 hours after online publication and is updated daily on week days.
Initial download of the metrics may take a while.