Fig. 3.
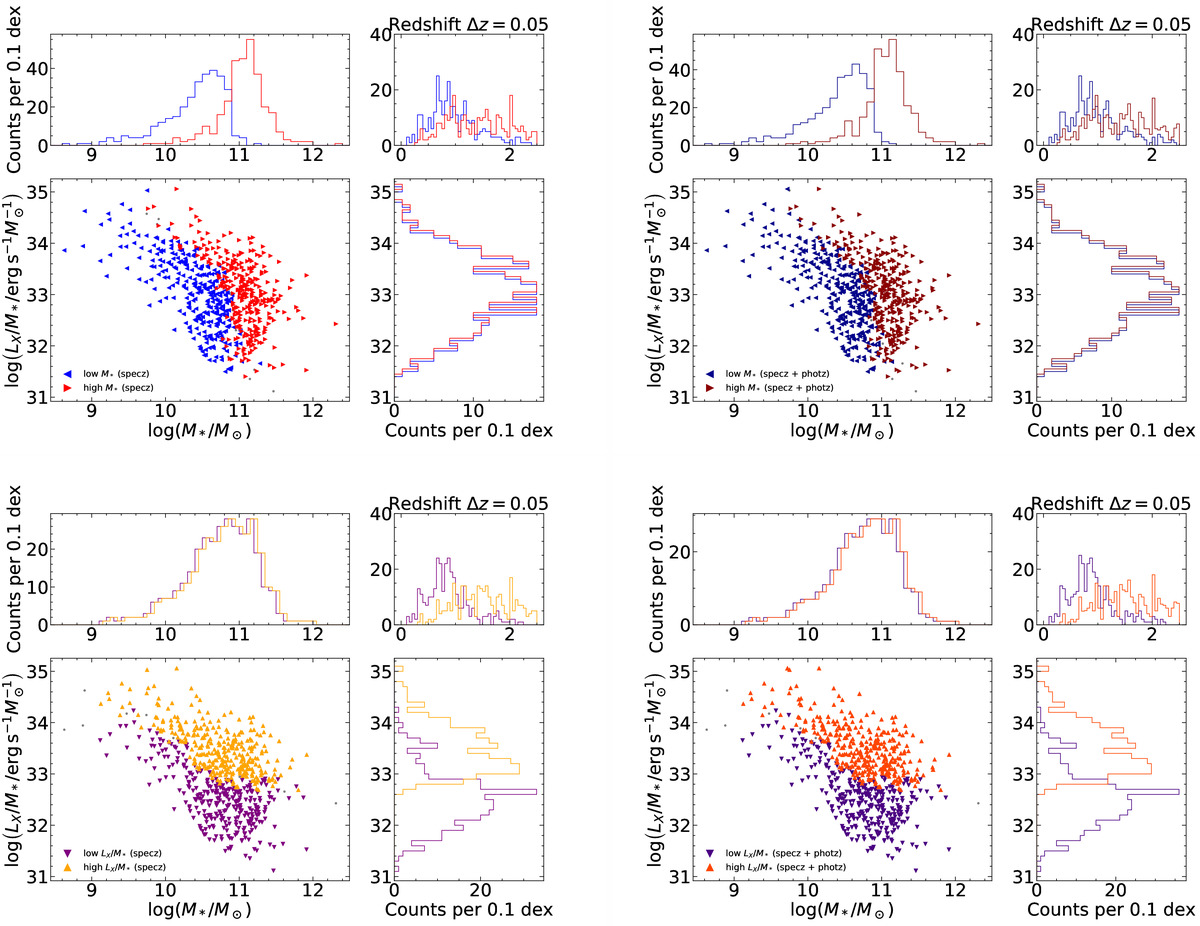
Distribution in terms of M*, LX/M*, and redshift for XMM-COSMOS AGN with known spec-z (left panels) and spec-z + phot-z Pdfs (right panels). The low and high M* subsamples are created so that they have exactly the same specific BH accretion rate distribution (upper panels). A similar approach is used in terms of specific BH accretion rate (lower panels). For clarity, when the histograms match exactly, we have slightly offset the bins visually for the high subsample.
Current usage metrics show cumulative count of Article Views (full-text article views including HTML views, PDF and ePub downloads, according to the available data) and Abstracts Views on Vision4Press platform.
Data correspond to usage on the plateform after 2015. The current usage metrics is available 48-96 hours after online publication and is updated daily on week days.
Initial download of the metrics may take a while.