| Issue |
A&A
Volume 629, September 2019
|
|
|---|---|---|
| Article Number | L3 | |
| Number of page(s) | 10 | |
| Section | Letters to the Editor | |
| DOI | https://doi.org/10.1051/0004-6361/201935162 | |
| Published online | 26 August 2019 | |
Letter to the Editor
The mass–size plane of EAGLE galaxies
1
Instituto de Astronomía y Física del Espacio, CONICET-UBA, Casilla de Correos 67, Suc. 28, 1428 Buenos Aires, Argentina
e-mail: This email address is being protected from spambots. You need JavaScript enabled to view it.
2
Departamento de Ciencias Físicas, Universidad Andrés Bello, 700 Fernandez Concha, Santiago, Chile
3
Millenium Institute of Astronomy, Universidad Andrés Bello, 700 Fernandez Concha, Santiago, Chile
4
International Centre for Radio Astronomy Research (ICRAR), M468, University of Western Australia, 35 Stirling Hwy, Crawley, WA 6009, Australia
5
ARC Centre of Excellence for All Sky Astrophysics in 3 Dimensions (ASTRO 3D), Australia
Received:
29
January
2019
Accepted:
23
July
2019
Abstract
Context. Current observational results show that both late- and early-type galaxies follow tight mass–size planes on which physical properties such as age, velocity dispersion, and metallicity correlate with the scatter on the plane.
Aims. We study the mass–size plane of galaxies in cosmological hydrodynamical simulations, as a function of velocity dispersion, age, chemical abundances, ellipticity, and spin parameters with the aim of assessing to what extent the current cosmological paradigm can reproduce these observations and provide a physical interpretation of them.
Methods. We selected a sample of well-resolved galaxies from the (100 Mpc)3 simulation of the EAGLE Project. This sample is composed of 508 spheroid-dominated galaxies and 1213 disc-dominated galaxies. The distributions of velocity dispersion, age, metallicity indicators and gradients, and spin parameters across the mass–size plane are analysed. Furthermore, we study the relation between shape and kinematic parameters. The results are compared with observations.
Results. The mass-weighted ages of the EAGLE galaxies are found to vary along lines of constant velocity dispersion on the mass–size plane, except for galaxies with velocity dispersions higher than ∼150 km s−1. Negative age gradients tend to be found in extended disc galaxies in agreement with observations. However, the age distributions of early-type galaxies show a larger fraction with inverted radial profiles. The distribution of metallicity gradients does not show any clear dependence on this plane. Galaxies with similar spin parameters (λ) display larger sizes as their dynamical masses increase. Stellar-weighted ages are found to be good proxies for λ in galaxies with low ellipticity (ε). A bimodal distribution of λ is found so that the high-λ peak is dominated by discs with young stellar populations (SPs), while the second peak is mainly populated by slow rotators (λ < 0.2) with old stars. Our findings suggest that the physical processes that regulate the star formation histories in galaxies might also affect the angular moment budgets of gas and stars, and as a consequence their morphology.
Key words: galaxies: formation / galaxies: elliptical and lenticular, cD / galaxies: abundances / galaxies: kinematics and dynamics
Corresponding Investigator, IATE-CONICET, Laprida 927, Córdoba, Argentina.
© ESO 2019
1. Introduction
The formation and evolution of galaxies is a complex interplay of different physical processes such as rapid gas collapse, disc mergers, minor mergers, and secular evolution, among others. These processes contribute to regulating the star formation activity and also to mixing the chemical elements, polluting the interstellar medium (ISM) of galaxies. The formation of spiral galaxies can be understood within the scenario of global conservation of specific angular momentum (Fall & Romanowsky 2013). However, in a hierarchical Universe mergers and interactions, and other environmental effects as well, may redistribute the angular momentum of gas and stars, modifying the morphologies and overall properties of galaxies (e.g. Pedrosa & Tissera 2015; Lagos et al. 2017, 2018a). Ellipticals are expected to have a complex formation history where these processes might also take place, albeit acting with different efficiencies and characteristics (Clauwens et al. 2018). In particular, the mass–size plane, which combines two fundamental properties of galaxies, could hold relevant information for the understanding of galaxy formation (Li et al. 2018, hereafter Li2018).
The galaxy assembly process is expected to leave imprints of chemical patterns on the stellar populations (SPs). As baryons are transformed into stars, stellar evolution takes place and new chemical elements are synthesised and ejected into the ISM at different stages of evolution of the stellar progenitors. The new-born SPs affect the chemical abundances of the ISM, building up the chemical history of galaxies. The growth of stellar mass and galaxy size via star formation, gas accretion, and/or galaxy mergers are therefore expected to be related to the properties of the SPs such as chemical abundance, kinematics and age.
With the recent help of integral-field spectroscopy (IFS) techniques, galaxy surveys such as MaNGA (Bundy et al. 2015), CALIFA (Sánchez et al. 2012), and SAMI (Bryant et al. 2015) have gathered information to allow the construction of the mass–size plane populated with enough galaxies to study the interdependences on those properties with higher statistical signals than was possible before (e.g. Ryden et al. 2001). Li2018 analysed the mass–size plane of early-type galaxies (ETGs) and late-type galaxies (LTGs) in the MaNGA survey, finding that both types of galaxies are on tight mass–size planes, which are consistent with the predictions of the virial theorem. Metallicities and ages are found to vary systematically on the mass–size plane, along the direction of constant velocity dispersion. Galaxies of different morphologies follow mass–size planes with distinct dependences on other galaxy properties. Overall, Li2018 found that the velocity dispersion can be used as a proxy for the bulge-to-total (B/T) ratio (e.g. Cappellari et al. 2013). In their sample, ETGs of higher velocity dispersion are typically associated with older and higher metallicity SPs. Additionally, van de Sande et al. (2018) analysed the link between the rotation-to-dispersion velocity ratio of a galaxy and its ellipticity, finding that stellar age follows ellipticity (ε) very well in oblate rotating spheroids. Graham et al. (2018) reported a bimodal distribution in the (λ, ε) plane of galaxies in the MaNGA survey, with the secondary peak being dominated by slow rotator galaxies.
Cosmological simulations that include chemical evolution are fundamental tools used to study the relation between dynamical, structural, and chemical properties (e.g. Mosconi et al. 2001; Lia et al. 2002; Tissera et al. 2012; Taylor & Kobayashi 2017). These simulations show that the formation of LTGs could be explained if overall global angular momentum conservation takes place. Hence, they mostly grow inside-out, leading to negative age and metallicity gradients (Tissera et al. 2016, 2019). These trends may be disturbed if processes such as galaxy mergers, bars, and migration take place. The formation of ETGs could involve the action of a variety of mechanisms at different stages of their evolution (Naab 2013), such as minor and major mergers, as well as early filamentary cold gas accretion. Galaxy mergers are considered the most efficient mechanisms to redistribute angular momentum and modify the morphologies of galaxies, among other galaxy properties (e.g. Bois et al. 2011; Perez et al. 2013; Naab et al. 2014; Lagos et al. 2018a). Lagos et al. (2018b) found that 70% of the slow rotators have experienced at least one important merger event in the EAGLE simulations. They also found that wet mergers tend to increase the λ while dry mergers have the opposite effect. Recently, van de Sande et al. (2019) analysed the structural, dynamical, and stellar age populations of galaxies in several large-volume simulations, including the EAGLE simulations, and compare them with IFS observations. These authors reported a good match of the mass–size plane between observations and simulated galaxies, but did not find a correlation between ε and age that resembled the observations.
In this paper, we analyse the mass–size relation of simulated galaxies extracted from the EAGLE simulations. The EAGLE simulations are able to reproduce relatively well the observed diversity of galaxy morphologies (Frenk et al. 2018, and references therein). We classify the analysed galaxies in spheroidal-dominated (hereafter, E-SDGs) and disc-dominated (E-DDGs) systems according to the fraction of their stellar mass that is rotationally supported. In a previous work, Rosito et al. (2019) studied the structural relations and the mass growth history (MGHs) of dispersion-dominated galaxies selected from the EAGLE project, finding that they are able to reproduce structural relations such as the mass–size relation and the fundamental plane. The MGHs analysis of Rosito et al. (2019) shows a trend for a coeval formation of the SPs in massive E-SDGs and for a weak outside-in formation in low-mass E-SDGs, driven by a rejuvenating star formation activity that took place in the central regions. On the other hand, the E-DDG galaxies tend to form inside-out as expected. We use 3D (real) and 2D (projected) distributions in order to analyse the intrinsic distributions and for comparison with observations.
This paper is organised as follows. In Sect. 2 we describe the main characteristics of the simulations. In Sect. 3 we explore the mass–size plane as a function of galaxy properties. Finally, in Sect. 4 we summarise our main findings.
2. Simulated galaxies
The EAGLE project is a suite of cosmological simulations1 that runs with a modified version of the GADGET-3 code that includes radiative cooling, star formation, chemical evolution, and stellar and AGN feedback (Schaye et al. 2015). Details on the subgrid physics adopted to simulate these processes can be found in Schaye et al. (2015), Crain et al. (2015), and Rosas-Guevara et al. (2016). The simulations are produced assuming a Λ Cold Dark Matter scenario with the Planck Cosmology (Planck Collaboration I 2014; Planck Collaboration XVI 2014). For this work, we use the 100 Mpc box-sized reference simulation that allows us to explore a large statistical sample of galaxies with different morphologies.
The classification of EAGLE galaxies into E-DDGs and E-SDGs has been done based on a dynamical criteria to define the rotational- and dispersion-dominated stellar components (i.e. disc and bulge, respectively) as explained in Tissera et al. (2019). Hence, all galaxies have been rotated so that the plane of rotation is perpendicular to the total angular momentum vector. Galaxies are classified according to their B/T ratio, which directly quantifies the stellar mass fraction that is dominated by velocity dispersion. For consistency with Rosito et al. (2019), we adopt B/T = 0.5 to separate disc-dominated (E-DDG) from bulge-dominated (E-SDG) galaxies. The analysed sample comprises 508 E-SDGs and 1213 E-DDGs resolved with more than 10 000 star particles within the optical radius2. They are all central galaxies, which corresponds to the main galaxy in the potential well of a halo. Satellite galaxies are not analysed in this work.
We define the 3D half-mass radius Rhm as the radius that encloses 50% of the stellar mass of the simulated galaxies. For each simulated galaxy, the median value of chemical abundances (O/H and [O/Fe]) are calculated within Rhm. We also estimate the dynamical mass (Mdyn), assuming virialisation for both the observations and the simulations, as shown in Rosito et al. (2019).
The chemical abundance and age profiles are estimated within three times the gravitational softening (0.7 kpc) and Rhm and normalised by Rhm. Linear regression fits (in logarithm space) are performed to the normalised profiles following the procedure given by Li2018 (within the same radial interval mentioned above).
We also estimated the projected half-mass radius,  . The λ and ε parameters are taken from Lagos et al. (2018b). These authors measured the r-band luminosity-weighted line-of-sight velocity stellar λ and ε at the projected half-r-band luminosity radius, using random inclinations to mimic observational procedures most closely.
3. Analysis
We explored the distributions of velocity dispersion, age, metallicity, and λ of the EAGLE galaxies on the mass–size plane. It is important to bear in mind that the observed and simulated samples were constructed using different selection criteria. Li2018 use the Sérsic index to distinguish ETGs and LTGs so that galaxies with nSersic > 2.5 are classified as early types. They also use the dynamical mass and the major semi-axis of the half-light isophote. For the selected EAGLE sample, we used the dynamical B/T ratio to distinguish morphologies and the half-mass radius as the characteristic size, consistently with Rosito et al. (2019). We also used the mass–size relations for passive and active star-forming (SF) galaxies reported by van der Wel et al. (2014). Passive SF galaxies are compared with E-SDGs, while active SF are compared with E-DDGs.
Figure 1 shows the stellar mass–size plane as a function of σe for E-SDGs, E-DDGs, and all galaxies together. In this case, we considered  in order to achieve a better comparison with the observations. We used the 2D locally weighted regression method to obtain smoothed distributions3 (LOESS; Cleveland & Devlin 1988). In Appendix B, figures with the real distributions are included for comparison. The stellar mass–size plane shows the expected trend for increasing sizes with stellar mass within the observational range reported by van der Wel et al. (2014). We find the best agreement for intermediate stellar mass galaxies ∼1010.3 M⊙ for both E-SDGs and E-DDGs (see also van de Sande et al. 2019).
Globally, it can be seen that larger galaxies have lower σe at a given stellar mass. E-DDGs systematically increase their stellar mass and size at fixed values of σe. However, σe is only a proxy of stellar mass in the case of E-SDGs. At a similar σe, E-DDGs are more extended than E-SDGs, possibly due to different assembly histories.
In Fig. 2, the dynamical mass–size plane is shown as a function of the stellar mass-weighted ages of the SPs following Li2018. The range of dynamical masses covered by the selected samples is narrower than that provided by the observations of Li2018. The lack of extended massive discs and the narrow range of dynamical masses could be partially due to the restricted simulated volume, which is ≈80% smaller than the volume covered by MaNGA.
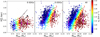 |
Fig. 1. Velocity dispersion (σe) LOESS-smoothed distributions on the stellar mass–size plane for E-SDGs (left panel), E-DDGs (middle panel), and all galaxies (right panel) in the EAGLE simulation at z = 0. The median relations for the EAGLE galaxies (pink rhombus) are also shown. For comparison, the median relations for passive galaxies (left panel), active galaxies (middle panel), and all galaxies together (right panel) reported by van der Wel et al. (2014) are inside the black rhombus. Error bars correspond to the 16th and 84th percentiles for both simulated and observed data. |
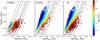 |
Fig. 2. Stellar mass-weighted average age LOESS-smoothed distributions on the dynamical mass–size plane for E-SDGs (left panel), E-DDGs (middle panel), and all galaxies (right panel) in the EAGLE simulation at z = 0. The dashed lines show the predicted distributions for systems with constant σe at 100, 125, 150, 200, 225, 250, and 300 km s−1 (from left to right). |
As can be seen, galaxies with similar median stellar ages move approximately along lines of constant σe, in agreement with observations. However, the trend has a slightly flatter slope for galaxies with σe > 150 km s−1. Young SPs dominate in galaxies with low stellar masses and σe. For a given dynamical mass, galaxies with overall old SPs are more compact, regardless of their morphology. These trends are in qualitative agreement with observational results shown in Li2018. We estimate that the youngest galaxies have median stellar ages of ∼3 Gyr and ∼3.7 Gyr for E-DDGs and E-SDGs, and the oldest galaxies of ∼12.5 Gyr for both type of galaxies. The median ages of both samples are ∼6.8 Gyr and ∼8.7 Gyr, respectively.
Figure 3 shows the distribution of age and stellar metallicity gradients across the dynamical mass–size plane. As can be seen for the upper panels, massive E-SDGs tend to have shallow or positive age gradients which are in global qualitative agreement with Li2018. Low-mass galaxies show a larger variety of age gradients that are not reported by Li2018, probably as a result of their later assembly histories (see Rosito et al. 2019). For E-DDGs, there is a clear trend for more extended galaxies to be more massive at a given age gradient. As the statistics are dominated by E-DDGs, when we analyse all the galaxies together, we find the trends to be similar to those of the E-DDGs. We note that the behaviour for E-DDGs is in good agreement with expectations of the inside-out formation model for disc galaxies. However, we acknowledge a lack of extended, massive galaxies in the EAGLE sample (van de Sande et al. 2019).
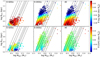 |
Fig. 3. Age (upper panels) and [O/H] (lower panels) gradients LOESS-smoothed distributions on the mass–size plane for E-SDGs (left panels), E-DDGs (middle panels), and all galaxies (right panels) in the EAGLE simulation at z = 0. The dashed lines are the same as in Fig. 2. |
The metallicity gradients are weakly correlated with dynamical mass (Tissera et al. 2019) and this is reflected in the mass–size plane shown in the lower panels in Fig. 3. For the E-DDGs, metallicity gradients are globally negative. There is a weak change in the slopes at about Mdyn ∼ 1010.5 M⊙. This trend is determined mainly by a fraction of the EAGLE galaxies that have weak or positive metallicity gradients around σe ∼ 150 km s−1.
We also analyse the mass–size plane as a function of the spin parameter λ and the relation of the latter with ε and the median stellar ages of galaxies. In Fig. 4, we show the distribution of λ on the dynamical mass–size plane (upper panels) in the same samples of Figs. 2 and 3 for comparison. As can be seen from this figure, there is a clear dependence on λ. Overall, E-SDGs have lower λ than E-SDGs. For both morphological types, at fixed Mdyn, λ varies smoothly with Rhm. We note that different colour bars are used in each panel in order to highlight the trends. This figure shows that galaxies with similar λ are located on tracks with positive slopes in the mass–size relation, so that more massive galaxies are more extended than less massive systems at fixed λ. When all galaxies are analysed together, this trend remains. For the range of masses we analyse, E-SDGs tend to be more compact than E-SDGs at a given dynamical mass, with the larger differences for the most extreme values of λ (Graham et al. 2018).
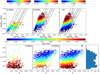 |
Fig. 4. Upper panel: spin parameter (λ) distribution on the mass–size plane for E-SDGs (left panel), E-DDGs (middle panel), and all galaxies (right panel) in the EAGLE simulation. The lines are the same as in Fig. 2. Lower panel: λ − ϵ plane coloured by stellar-mass weighted ages. We depict the slow rotator region according to the definition in Graham et al. (2018) (black lines). Lower right panel: histogram of λ for the complete sample. |
The lower panels of Fig. 4 show λ − ε as a function of the stellar mass-weighted ages. As can be seen, the tracks of constant age are flat for ε < ∼0.3, indicating that for more oblate systems, stellar age is found to be a good proxy of λ. For both morphological types, older SPs are found in galaxies with lower λ. This is consistent with these systems having experienced a larger number of (dry) mergers while those with higher λ values have progressively younger SPs, consistent with having more extended star formation histories. We note that galaxies with ε > ∼0.3 seem to be younger compared to those with smaller degree of ellipticity at fixed λ. However, no clean proxy for λ is found in these galaxies.
Following previous works, if we take λ ∼ 0.2 as a suitable value to separate fast and slow rotators (based on the λ − ϵ distribution of EAGLE galaxies presented; see Fig. 3 in Lagos et al. 2018b), we found that 55% of the E-SDGs are slow rotators populated by old stars on average, while only 8% of the E-DDGs are classified as slow rotators. If instead we use the definition adopted by Graham et al. (2018), the fractions are ∼28% and ∼2%, respectively. The fraction of fast rotators in E-SDGs is ∼71%, in agreement with the results reported by Lagos et al. (2018b). However this fraction is lower than that found by Emsellem et al. (2011) for ATLAS3D (∼86% ) though this could be caused by ATLAS3D selecting (by construction) ETGs only. Slow rotators in the EAGLE simulations are detected mostly in dispersion-dominated systems with old SPs. They define the second peak in the λ histogram shown in the lower panel of Fig. 4. This histogram shows a bimodal distribution with the first peak populated by disc galaxies (with young SPs), while the second peak is populated by slow-rotator galaxies (with old SPs). The EAGLE galaxies are found to reproduce well the MaNGA distribution reported by Graham et al. (2018).
4. Conclusions
Using a galaxy sample of simulated galaxies selected from the large (100 Mpc)3 simulation of the EAGLE Project, we performed a statistical analysis of the dependence of the mass–size plane on a variety of galaxy properties. Our main results can be summarised as follows:
-
Early- and late-type galaxies in the EAGLE simulations, called E-SDGs and E-DDGs, are found to follow stellar mass–size planes in global agreement with observations, principally for galaxies with stellar masses of ∼1010.3 M⊙. Lower and higher mass galaxies show discrepancies, but are within the observed ranges reported by van der Wel et al. (2014). Larger galaxies have lower σe values at fixed mass for simulated late-type galaxies. In the case of the simulated early-type systems, stellar mass is found to be a good proxy of σe.
-
Galaxies dominated by old stars are more compact at fixed dynamical mass. Li2018 report σe to be a good proxy for the stellar age. We find this to be on average valid for EAGLE galaxies. However, mean stellar ages show a slightly weaker trend than σe for massive disc galaxies, which is not observed in Li2018.
-
More extended discs have steeper negative age gradients, while early-type galaxies show weak or more positive age gradients. The latter trend seems to be in agreement with the slight outside-in assembly histories of low-mass, early-type galaxies reported by Rosito et al. (2019).
-
Chemical abundances are found to have a shallower dependence on stellar mass or σe than reported by observations (see Appendix A). Reproducing the observed trends with metallicity seems to be a major challenge for cosmological simulations.
-
Overall, we find that age can be used as a proxy for λ for more oblate systems, as reported by van de Sande et al. (2019). Because the adopted morphological classification is based on the level of rotation in galaxies, this implies that morphology is a good proxy for age. However, ε does not show a clear trend with stellar age in the EAGLE galaxies.
-
The distributions of EAGLE galaxies in the (λ, ε) plane shows a bimodal distribution of λ where the extended disc systems with young stars populate the first peak, while the second peak is dominated by slow rotator galaxies with old SPs.
These results suggest that the processes regulating star formation activity (and hence the age distributions) might also affect the redistribution of angular momentum of stars and gas, and hence, galaxy morphology. Despite the many successes of the current generation of cosmological hydrodynamical simulations, some important shortcomings remain. In the area of stellar populations, we find that some important ones are related to the metallicity profiles and age-morphology relation in galaxies. Further work on the multi-phase nature of the ISM in simulations could naturally lead to more realistic internal kinematics and profiles of galaxies, and hence its exploration is crucial.
We used the publicly available database by McAlpine et al. (2016).
The optical radius is defined as the radius that encloses 80% of the baryonic mass of the galaxy.
The colour bars are defined by using the first and third quartile as limits.
Acknowledgments
We thank J. Trayford and J. van de Sande for their valuable comments to this work. PBT acknowledges partial funding from Fondecyt Regular 2015 – 1150334 and Proyecto Interno UNAB 2019. This project has received funding from the European Union Horizon 2020 Research and Innovation Programme under the Marie Sklodowska-Curie grant agreement No 734374 and the GALNET network funded by Conicyt. CL is funded by the ARC Centre of Excellence for All Sky Astrophysics in 3 Dimensions (ASTRO 3D), through project number CE170100013. This work used the DiRAC Data Centric system at Durham University, operated by the Institute for Computational Cosmology on behalf of the STFC DiRAC HPC Facility (www.dirac.ac.uk). This equipment was funded by BIS National E-infrastructure capital grant ST/K00042X/1, STFC capital grants ST/H008519/1 and ST/K00087X/1, STFC DiRAC Operations grant ST/K003267/1, and Durham University. DiRAC is part of the National E-Infrastructure. We acknowledge PRACE for granting us access to the Curie machine based in France at TGCC, CEA, Bruyères-le-Chatel. This work used RAGNAR cluster funded by Fondecyt Regular 2015 - 1150334 at Universidad Andres Bello.
References
- Bois, M., Emsellem, E., Bournaud, F., et al. 2011, MNRAS, 416, 1654 [NASA ADS] [CrossRef] [Google Scholar]
- Bryant, J. J., Owers, M. S., Robotham, A. S. G., et al. 2015, MNRAS, 447, 2857 [NASA ADS] [CrossRef] [Google Scholar]
- Bundy, K., Bershady, M. A., Law, D. R., et al. 2015, ApJ, 798, 7 [NASA ADS] [CrossRef] [Google Scholar]
- Cappellari, M., McDermid, R. M., Alatalo, K., et al. 2013, MNRAS, 432, 1862 [NASA ADS] [CrossRef] [Google Scholar]
- Clauwens, B., Schaye, J., Franx, M., & Bower, R. G. 2018, MNRAS, 478, 3994 [NASA ADS] [CrossRef] [Google Scholar]
- Cleveland, W. S., & Devlin, S. J. 1988, J. Am. Stat. Assoc., 83, 596 [CrossRef] [Google Scholar]
- Crain, R. A., Schaye, J., Bower, R. G., et al. 2015, MNRAS, 450, 1937 [NASA ADS] [CrossRef] [Google Scholar]
- De Rossi, M. E., Bower, R. G., Font, A. S., Schaye, J., & Theuns, T. 2017, MNRAS, 472, 3354 [NASA ADS] [CrossRef] [Google Scholar]
- Emsellem, E., Cappellari, M., Krajnović, D., et al. 2011, MNRAS, 414, 888 [NASA ADS] [CrossRef] [Google Scholar]
- Fall, S. M., & Romanowsky, A. J. 2013, ApJ, 769, L26 [NASA ADS] [CrossRef] [Google Scholar]
- Frenk, C. S., Theuns, T., Trayford, J. W., Correa, C., & Schaye, J. 2018, MNRAS, 483, 744 [Google Scholar]
- Graham, M. T., Cappellari, M., Li, H., et al. 2018, MNRAS, 477, 4711 [NASA ADS] [CrossRef] [Google Scholar]
- Lagos, C. d. P., Theuns, T., Stevens, A. R. H., et al. 2017, MNRAS, 464, 3850 [NASA ADS] [CrossRef] [Google Scholar]
- Lagos, C. d. P., Stevens, A. R. H., Bower, R. G., et al. 2018a, MNRAS, 473, 4956 [NASA ADS] [CrossRef] [Google Scholar]
- Lagos, C. d. P., Schaye, J., Bahé, Y., et al. 2018b, MNRAS, 476, 4327 [NASA ADS] [CrossRef] [Google Scholar]
- Li, H., Mao, S., Cappellari, M., et al. 2018, MNRAS, 476, 1765 [NASA ADS] [Google Scholar]
- Lia, C., Portinari, L., & Carraro, G. 2002, MNRAS, 330, 821 [NASA ADS] [CrossRef] [Google Scholar]
- McAlpine, S., Helly, J. C., Schaller, M., et al. 2016, Astron. Comput., 15, 72 [NASA ADS] [CrossRef] [Google Scholar]
- Mosconi, M. B., Tissera, P. B., Lambas, D. G., & Cora, S. A. 2001, MNRAS, 325, 34 [NASA ADS] [CrossRef] [Google Scholar]
- Naab, T. 2013, in The Intriguing Life of Massive Galaxies, eds. D. Thomas, A. Pasquali, & I. Ferreras, IAU Symp., 295, 340 [NASA ADS] [Google Scholar]
- Naab, T., Oser, L., Emsellem, E., et al. 2014, MNRAS, 444, 3357 [NASA ADS] [CrossRef] [Google Scholar]
- Pedrosa, S. E., & Tissera, P. B. 2015, A&A, 584, A43 [NASA ADS] [CrossRef] [EDP Sciences] [Google Scholar]
- Perez, J., Valenzuela, O., Tissera, P. B., & Michel-Dansac, L. 2013, MNRAS, 436, 259 [NASA ADS] [CrossRef] [Google Scholar]
- Planck Collaboration I. 2014, A&A, 571, A1 [NASA ADS] [CrossRef] [EDP Sciences] [Google Scholar]
- Planck Collaboration XVI. 2014, A&A, 571, A16 [NASA ADS] [CrossRef] [EDP Sciences] [Google Scholar]
- Rosas-Guevara, Y., Bower, R. G., Schaye, J., et al. 2016, MNRAS, 462, 190 [NASA ADS] [CrossRef] [Google Scholar]
- Rosito, M. S., Tissera, P. B., Pedrosa, S. E., & Rosas-Guevara, Y. 2019, A&A, in press, https://doi.org/10.1051/0004-6361/201834720 [Google Scholar]
- Ryden, B. S., Forbes, D. A., & Terlevich, A. I. 2001, MNRAS, 326, 1141 [NASA ADS] [CrossRef] [Google Scholar]
- Sánchez, S. F., Kennicutt, R. C., Gil de Paz, A., et al. 2012, A&A, 538, A8 [NASA ADS] [CrossRef] [EDP Sciences] [Google Scholar]
- Schaye, J., Crain, R. A., Bower, R. G., et al. 2015, MNRAS, 446, 521 [Google Scholar]
- Scott, N., Brough, S., Croom, S. M., et al. 2017, MNRAS, 472, 2833 [NASA ADS] [CrossRef] [Google Scholar]
- Taylor, P., & Kobayashi, C. 2017, MNRAS, 471, 3856 [NASA ADS] [CrossRef] [Google Scholar]
- Tissera, P. B., White, S. D. M., & Scannapieco, C. 2012, MNRAS, 420, 255 [NASA ADS] [CrossRef] [Google Scholar]
- Tissera, P. B., Machado, R. E. G., Sanchez-Blazquez, P., et al. 2016, A&A, 592, A93 [NASA ADS] [CrossRef] [EDP Sciences] [Google Scholar]
- Tissera, P. B., Rosas-Guevara, Y., Bower, R. G., et al. 2019, MNRAS, 482, 2208 [NASA ADS] [CrossRef] [Google Scholar]
- van der Wel, A., Franx, M., van Dokkum, P. G., et al. 2014, ApJ, 788, 28 [NASA ADS] [CrossRef] [Google Scholar]
- van de Sande, J., Scott, N., Bland-Hawthorn, J., et al. 2018, Nat. Astron., 2, 483 [NASA ADS] [CrossRef] [Google Scholar]
- van de Sande, J., Lagos, C. D. P., Welker, C., et al. 2019, MNRAS, 484, 869 [NASA ADS] [CrossRef] [Google Scholar]
Appendix A: Supplementary information on EAGLE galaxies
Mass–size plane as a function of metallicity. As a function of chemical abundances, we find very weak trends either using (O/H) or [O/Fe] as shown in Fig. A.1. This is consistent with previous results (De Rossi et al. 2017; Tissera et al. 2019). There are also quite large dispersions in the values, which makes it difficult to identify clear trends (see also Tissera & Solar, in prep., for a discussion on the metallicity dispersion). The [O/Fe] distribution shows a slight trend for massive E-SDGs to have higher values. This is expected since massive E-SDGs would tend to form stars in short and strong starbursts (Rosito et al. 2019), and hence the chemical abundances are mainly determined by SNe II nucleosynthesis (Scott et al. 2017). It is also interesting to note that, at a given stellar mass, there is a trend for more massive galaxies to have lower [O/Fe]. Nevertheless, we note that for both type of galaxies no systematic dependences of chemical abundances with mass or σe are detected.
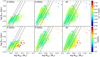 |
Fig. A.1. Median (O/H)+12 (upper panels) and [O/Fe] (lower panels) LOESS-smoothed distributions on the mass–size plane for E-SDGs (left panel), E-DDGs (middle panel) and all galaxies (right panel) in the EAGLE sample. The lines are the same as in Fig. 2. |
Appendix B: Real distributions
In this section, we include the collection of figures shown in the main paper and in Appendix A, using the real distributions instead of LOESS-smoothed distributions. This set of figures is given only for comparison.
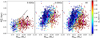 |
Fig. B.1. Velocity dispersion (σe) LOESS-smoothed distributions on the stellar mass–size plane for E-SDGs (left panel), E-DDGs (middle panel) and all galaxies (right panel) in the EAGLE simulation at z = 0. The median relations for the EAGLE galaxies (pink rhombus) are also shown. For comparison the median relations for passive (left panel), active (middle panel) and all galaxies together (right panel) reported by van der Wel et al. (2014) are also included in black rhombus Error bars correspond to the 16 and 84 percentiles for both simulated and observed data. See Fig. 1 for the smoothed version. |
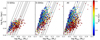 |
Fig. B.2. Stellar mass-weighted average age LOESS-smoothed distributions on the dynamical mass–size plane for E-SDGs (left panel), E-DDGs (middle panel), and all galaxies (right panel) in the EAGLE simulation at z = 0. The dashed lines show the predicted distributions for systems with constant σe at 100, 125, 150, 200, 225, 250, and 300 km s−1 (from left to right). See Fig. 2 for the smoothed version. |
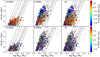 |
Fig. B.3. Age (upper panels) and [O/H] (lower panels) gradient LOESS-smoothed distributions on the mass–size plane for E-SDGs (left panels), E-DDGs (middle panels), and all galaxies (right panels) in the EAGLE simulation at z = 0. The dashed lines are the same as in Fig. 2. See Fig. 3 for the smoothed version. |
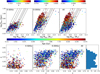 |
Fig. B.4. Upper panel: spin parameter (λ) distribution on the mass–size plane for E-SDGs (left panel), E-DDGs (middle panel), and all galaxies (right panel) in the EAGLE simulation. The lines are the same as in Fig. 2. Lower panel: λ − ϵ plane colour-coded according to stellar-mass weighted ages. We show the slow rotator region according to the definition in Graham et al. (2018) (black lines). Lower right panel: histogram of λ for the complete sample. See Fig. 4 for the smoothed version. |
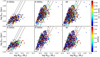 |
Fig. B.5. Median (O/H)+12 (upper panels) and [O/Fe] (lower panels) distributions on the mass–size plane for E-SDGs (left panel), E-DDGs (middle panel), and all galaxies (right panel) in the EAGLE sample. The lines are as in Fig. 1. See Fig. A.1 for the smoothed version. |
All Figures
|
Fig. 1. Velocity dispersion (σe) LOESS-smoothed distributions on the stellar mass–size plane for E-SDGs (left panel), E-DDGs (middle panel), and all galaxies (right panel) in the EAGLE simulation at z = 0. The median relations for the EAGLE galaxies (pink rhombus) are also shown. For comparison, the median relations for passive galaxies (left panel), active galaxies (middle panel), and all galaxies together (right panel) reported by van der Wel et al. (2014) are inside the black rhombus. Error bars correspond to the 16th and 84th percentiles for both simulated and observed data. |
| In the text | |
|
Fig. 2. Stellar mass-weighted average age LOESS-smoothed distributions on the dynamical mass–size plane for E-SDGs (left panel), E-DDGs (middle panel), and all galaxies (right panel) in the EAGLE simulation at z = 0. The dashed lines show the predicted distributions for systems with constant σe at 100, 125, 150, 200, 225, 250, and 300 km s−1 (from left to right). |
| In the text | |
|
Fig. 3. Age (upper panels) and [O/H] (lower panels) gradients LOESS-smoothed distributions on the mass–size plane for E-SDGs (left panels), E-DDGs (middle panels), and all galaxies (right panels) in the EAGLE simulation at z = 0. The dashed lines are the same as in Fig. 2. |
| In the text | |
|
Fig. 4. Upper panel: spin parameter (λ) distribution on the mass–size plane for E-SDGs (left panel), E-DDGs (middle panel), and all galaxies (right panel) in the EAGLE simulation. The lines are the same as in Fig. 2. Lower panel: λ − ϵ plane coloured by stellar-mass weighted ages. We depict the slow rotator region according to the definition in Graham et al. (2018) (black lines). Lower right panel: histogram of λ for the complete sample. |
| In the text | |
|
Fig. A.1. Median (O/H)+12 (upper panels) and [O/Fe] (lower panels) LOESS-smoothed distributions on the mass–size plane for E-SDGs (left panel), E-DDGs (middle panel) and all galaxies (right panel) in the EAGLE sample. The lines are the same as in Fig. 2. |
| In the text | |
|
Fig. B.1. Velocity dispersion (σe) LOESS-smoothed distributions on the stellar mass–size plane for E-SDGs (left panel), E-DDGs (middle panel) and all galaxies (right panel) in the EAGLE simulation at z = 0. The median relations for the EAGLE galaxies (pink rhombus) are also shown. For comparison the median relations for passive (left panel), active (middle panel) and all galaxies together (right panel) reported by van der Wel et al. (2014) are also included in black rhombus Error bars correspond to the 16 and 84 percentiles for both simulated and observed data. See Fig. 1 for the smoothed version. |
| In the text | |
|
Fig. B.2. Stellar mass-weighted average age LOESS-smoothed distributions on the dynamical mass–size plane for E-SDGs (left panel), E-DDGs (middle panel), and all galaxies (right panel) in the EAGLE simulation at z = 0. The dashed lines show the predicted distributions for systems with constant σe at 100, 125, 150, 200, 225, 250, and 300 km s−1 (from left to right). See Fig. 2 for the smoothed version. |
| In the text | |
|
Fig. B.3. Age (upper panels) and [O/H] (lower panels) gradient LOESS-smoothed distributions on the mass–size plane for E-SDGs (left panels), E-DDGs (middle panels), and all galaxies (right panels) in the EAGLE simulation at z = 0. The dashed lines are the same as in Fig. 2. See Fig. 3 for the smoothed version. |
| In the text | |
|
Fig. B.4. Upper panel: spin parameter (λ) distribution on the mass–size plane for E-SDGs (left panel), E-DDGs (middle panel), and all galaxies (right panel) in the EAGLE simulation. The lines are the same as in Fig. 2. Lower panel: λ − ϵ plane colour-coded according to stellar-mass weighted ages. We show the slow rotator region according to the definition in Graham et al. (2018) (black lines). Lower right panel: histogram of λ for the complete sample. See Fig. 4 for the smoothed version. |
| In the text | |
|
Fig. B.5. Median (O/H)+12 (upper panels) and [O/Fe] (lower panels) distributions on the mass–size plane for E-SDGs (left panel), E-DDGs (middle panel), and all galaxies (right panel) in the EAGLE sample. The lines are as in Fig. 1. See Fig. A.1 for the smoothed version. |
| In the text | |
Current usage metrics show cumulative count of Article Views (full-text article views including HTML views, PDF and ePub downloads, according to the available data) and Abstracts Views on Vision4Press platform.
Data correspond to usage on the plateform after 2015. The current usage metrics is available 48-96 hours after online publication and is updated daily on week days.
Initial download of the metrics may take a while.