Fig. 7.
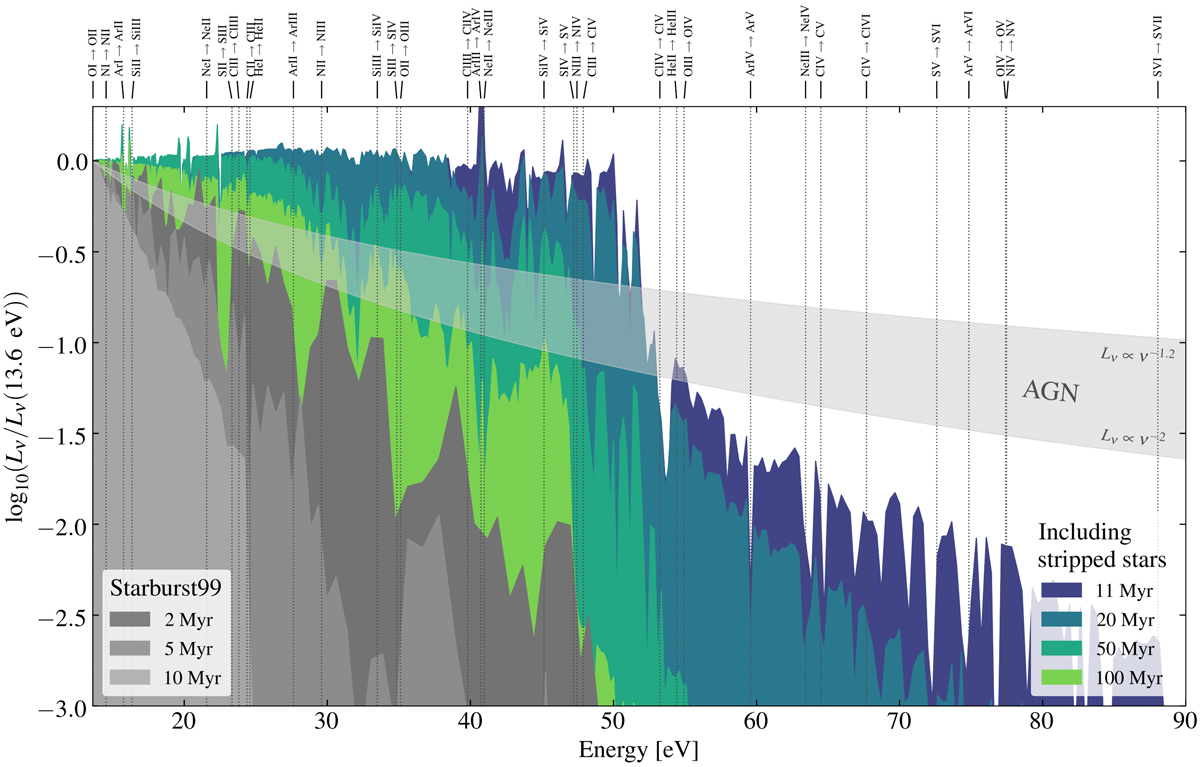
Shape of the ionizing part of the spectra of co-eval stellar populations compared to that of AGN, shown by normalizing the spectra at the H I-ionizing threshold at the photon energy 13.6 eV. We use gray for the spectra of stellar populations that only contain single stars and green for spectra of stellar populations in which stripped stars are included. Expected spectral slopes for AGN are indicated in transparent gray. We mark the ionization thresholds of different ionization stages for a variety of elements above the figure.
Current usage metrics show cumulative count of Article Views (full-text article views including HTML views, PDF and ePub downloads, according to the available data) and Abstracts Views on Vision4Press platform.
Data correspond to usage on the plateform after 2015. The current usage metrics is available 48-96 hours after online publication and is updated daily on week days.
Initial download of the metrics may take a while.