Fig. 6.
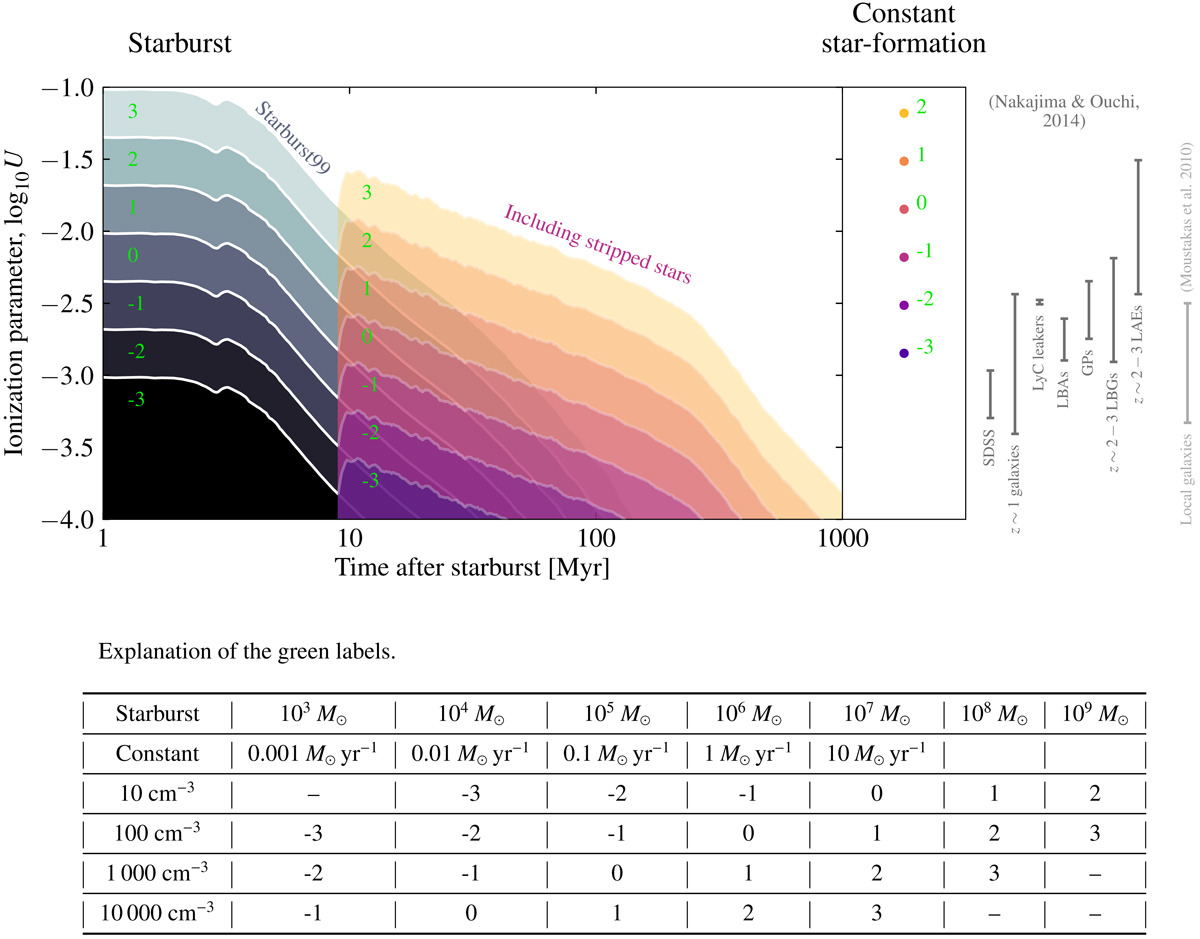
Top: ionization parameter computed for co-eval stellar populations as a function of time and for constant star formation, taken after 500 Myr. We show the predictions for stellar populations containing only single stars in gray shades and the model when stripped stars are included in purple shades. For constant star formation, the contribution from stripped stars is about 2% and therefore we do not show the markers for single star populations as they overlap. We show measurements of the ionization parameter for groups of observed galaxies to the right of the diagram (Moustakas et al. 2010; Nakajima & Ouchi 2014). Bottom: table explaining which gas density and stellar mass for co-eval stellar populations that correspond to which contour in the diagram using numbers as labels. In the case of constant star formation, the numbers are correlated with combinations of the gas density and star formation rate instead.
Current usage metrics show cumulative count of Article Views (full-text article views including HTML views, PDF and ePub downloads, according to the available data) and Abstracts Views on Vision4Press platform.
Data correspond to usage on the plateform after 2015. The current usage metrics is available 48-96 hours after online publication and is updated daily on week days.
Initial download of the metrics may take a while.