Fig. 5.
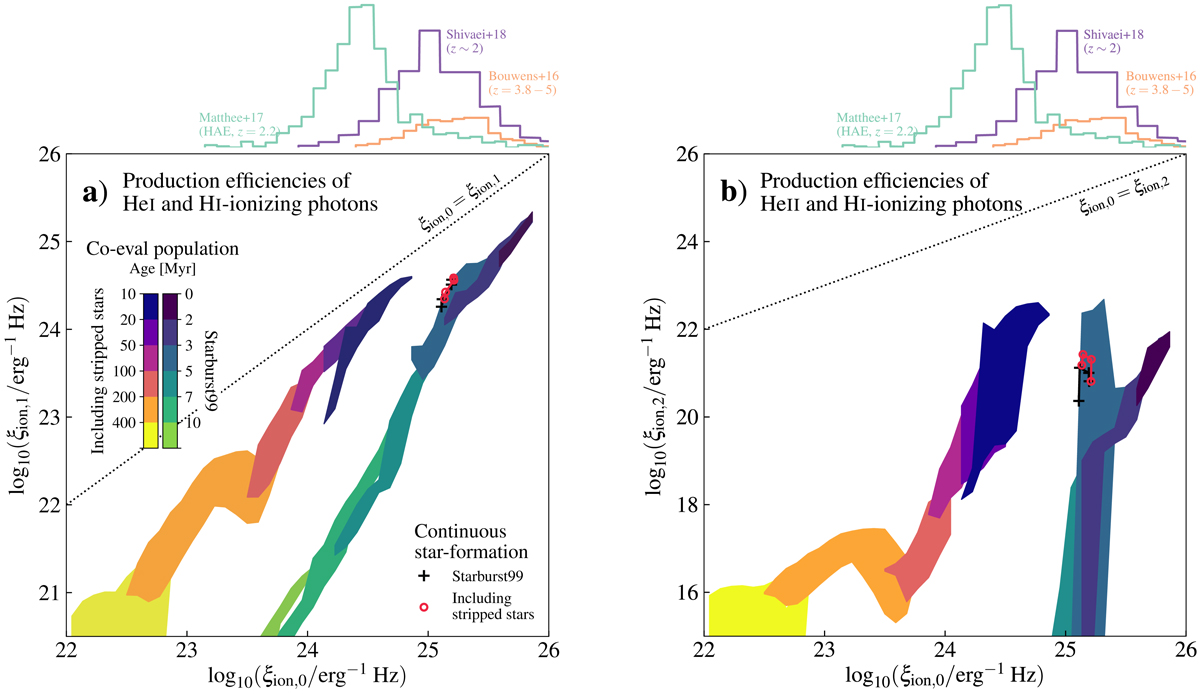
Diagrams showing the hardness of the ionizing part of the spectrum of stellar populations, constructed by the production efficiencies of H I- and He I- (panel a) or He II-ionizing photons (panel b) (ξion, 0, ξion, 1, ξion, 2). The colored regions represent the time spans indicated by the color bars for co-eval stellar populations and cover the predictions from all metallicities (from solar metallicity down to Z = 0.0002 for stripped stars, see Appendix A and Table A.1). Green shades show predictions for young, single star populations, while the purple and red shades represent the hardness of stellar populations in which stripped stars are included. The case of constant star formation is shown with solid lines and markers (pluses in black for single stars and circles in red for when stripped stars are included), taken after 500 Myr. Above the diagrams, we show the distribution of measured ξion, 0 for three samples of observed unresolved stellar populations from intermediate to high-redshift by Bouwens et al. (2016), Matthee et al. (2017), and Shivaei et al. (2018).
Current usage metrics show cumulative count of Article Views (full-text article views including HTML views, PDF and ePub downloads, according to the available data) and Abstracts Views on Vision4Press platform.
Data correspond to usage on the plateform after 2015. The current usage metrics is available 48-96 hours after online publication and is updated daily on week days.
Initial download of the metrics may take a while.