Fig. 2.
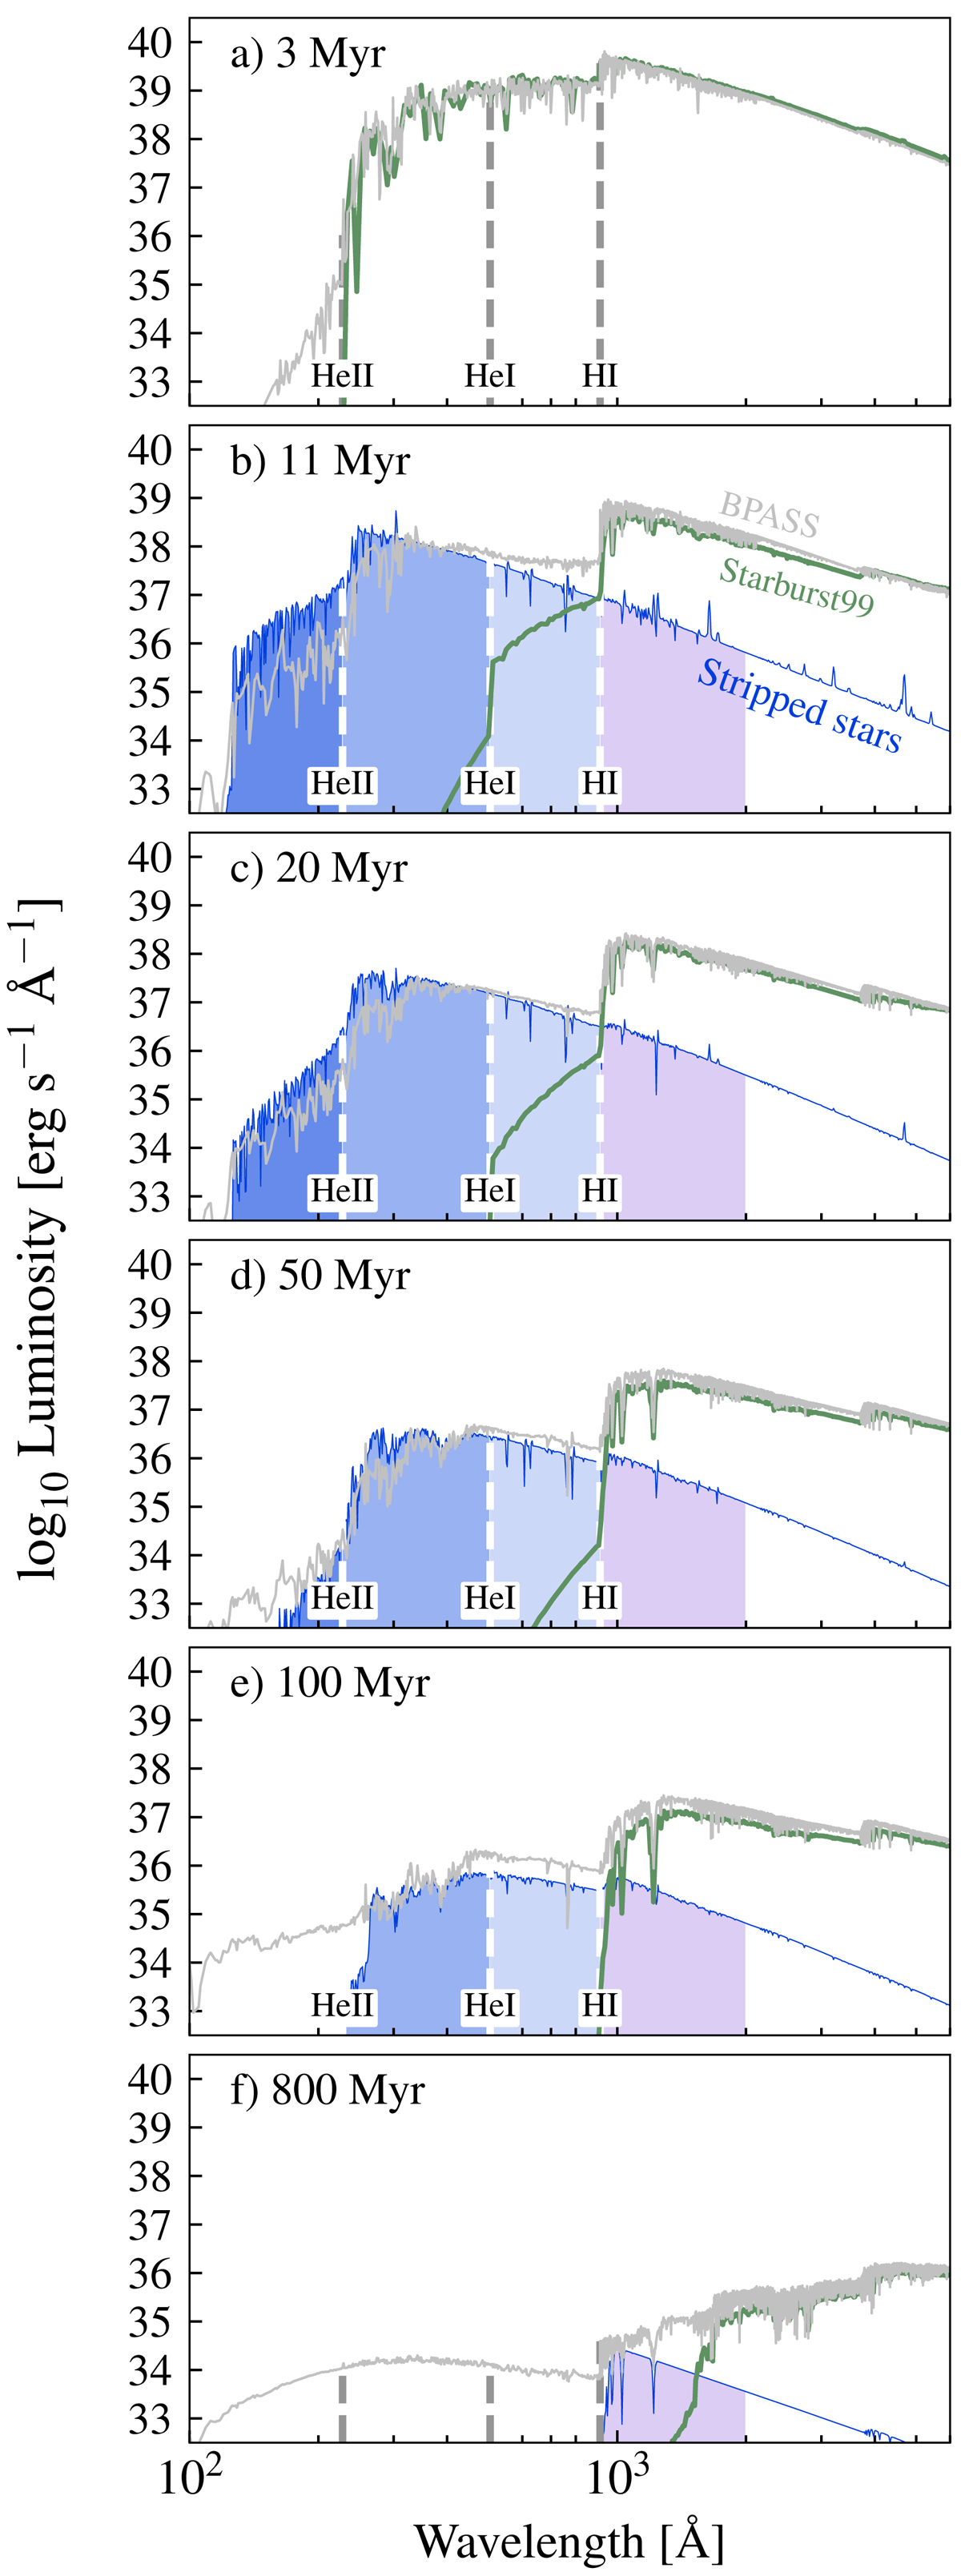
Spectral energy distribution of a co-eval stellar population. The contribution from stripped stars is highlighted with a blue line. The parts of the spectra that are H I-, He I-, and He II-ionizing are shaded in blue, while the UV is shaded in purple. For comparison, we show the spectral energy distribution of a population containing only single stars using STARBURST99 (green line), which can be interpreted as the contribution from the remaining stars in the stellar population. We also show the predictions from BPASS (gray line), where the effects of binary interaction are included. The panels correspond to different times after the instantaneous starburst of 106 M⊙. The model shown here assumes solar metallicity (see Appendix A for lower metallicity models).
Current usage metrics show cumulative count of Article Views (full-text article views including HTML views, PDF and ePub downloads, according to the available data) and Abstracts Views on Vision4Press platform.
Data correspond to usage on the plateform after 2015. The current usage metrics is available 48-96 hours after online publication and is updated daily on week days.
Initial download of the metrics may take a while.