Fig. C.2.
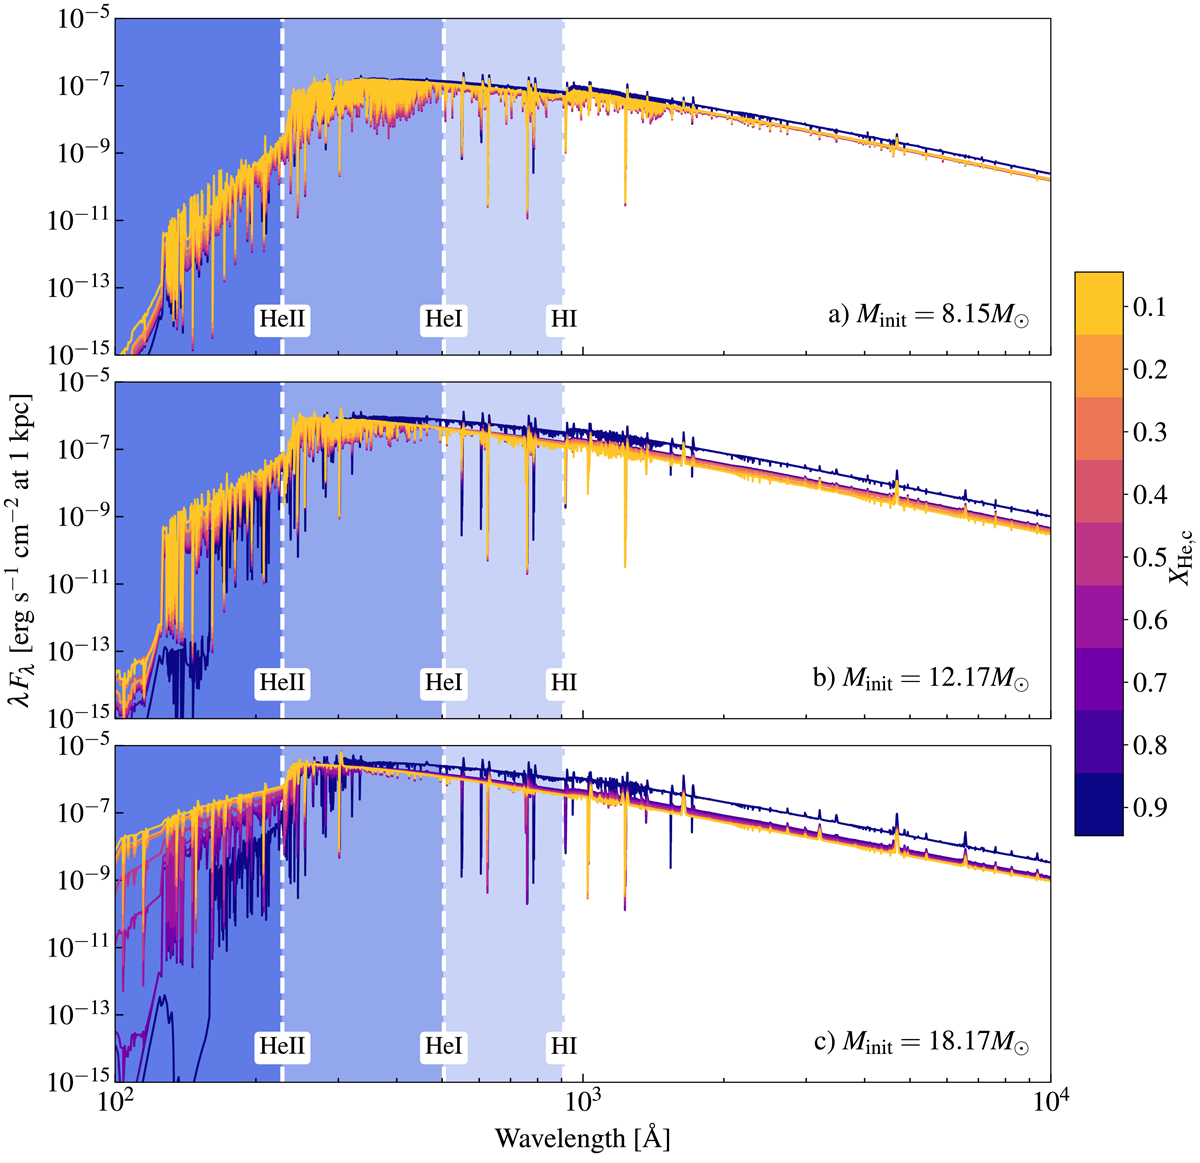
Spectral energy distributions modeled at nine different times during the evolution of stripped stars. The displayed models are for stars with initial masses of 8.15 (top), 12.17 (middle), and 18.17 M⊙ (bottom). The spectral models are created during the helium core burning at the time when the stripped stars have central helium mass fractions of XHe, c = 0.9, 0.8, ...0.1, which we highlight using purple, pink, and yellow colors. We use blue colors to mark the parts of the spectra that are H I-, He I-, and He II-ionizing. The spectral models are very similar during the stripped phases for the three stars, with the exception of the uncertain He II-ionizing part of the spectrum.
Current usage metrics show cumulative count of Article Views (full-text article views including HTML views, PDF and ePub downloads, according to the available data) and Abstracts Views on Vision4Press platform.
Data correspond to usage on the plateform after 2015. The current usage metrics is available 48-96 hours after online publication and is updated daily on week days.
Initial download of the metrics may take a while.