| Issue |
A&A
Volume 629, September 2019
|
|
|---|---|---|
| Article Number | A44 | |
| Number of page(s) | 8 | |
| Section | Extragalactic astronomy | |
| DOI | https://doi.org/10.1051/0004-6361/201833954 | |
| Published online | 03 September 2019 | |
Nuclear angular momentum of early-type galaxies hosting nuclear star clusters⋆
1
ESO, Karl-Schwarzschild-Str. 2, 85748 Garching bei München, Germany
e-mail: This email address is being protected from spambots. You need JavaScript enabled to view it.
2
Max Planck Institute for Astronomy, Königstuhl 17, 69117 Heidelberg, Germany
Received:
25
July
2018
Accepted:
22
March
2019
Abstract
Context. Nucleation is a common phenomenon in all types of galaxies and at least 70% of them host nuclear star clusters (NSCs) in their centres. Many of the NSCs co-habit with supermassive black holes and follow similar scaling relations with host galaxy properties. Unlike black holes, NSCs, preserve the signature of their evolutionary path imprinted onto their kinematics and stellar populations. Thus their study provides us with important information about the formation of galactic nuclei.
Aims. In this paper we explored the angular momentum of the nuclei of six intermediate mass (9.7 > log(Mdyn/M⊙) > 10.6) early-type galaxies that host NSCs and are located in the Fornax cluster. Our goal was to derive a link between the nuclear angular momentum and the proposed formation scenarios of NSCs.
Methods. We used adaptive optics assisted IFU observations with VLT/SINFONI to derive the spatially resolved stellar kinematics of the galaxy nuclei. We measured their specific stellar angular momenta λRe, and compared these with Milky Way globular clusters (GCs) and N-body simulations of NSC formation.
Results. We found that all studied nuclei exhibit varied stellar kinematics. Their λRe and ellipticities are similar to Milky Way GCs. Five out of six galaxy nuclei are consistent with the λRe − ϵe of simulated NSCs embedded in a contaminating nuclear bulge that have formed via the in-spiralling and merging of GCs.
Conclusion. It has previously been suggested that the NSCs in higher mass galaxies, such as those studied in this paper, form via dissipational sinking of gas onto the galactic nuclei with hints that some might also involve the merger of GCs. In this work we show that we cannot exclude the pure GC merging scenario as a viable path for the formation of NSCs.
Key words: galaxies: elliptical and lenticular, cD / galaxies: nuclei / galaxies: kinematics and dynamics
Based on observation collected at the ESO Paranal La Silla Observatory, Chile, Prog. ID 092.B-0892, PI Lyubenova and ID 380.B-0530, PI Infante.
© ESO 2019
1. Introduction
Observations made over the last few decades have shown that nucleation is a common phenomenon, with at least 70% of galaxies over a broad mass range hosting a nuclear star cluster (NSC) in their photometric and kinematic centres (e.g. Böker et al. 2002; Côté et al. 2006; Neumayer et al. 2011; Turner et al. 2012; den Brok et al. 2014; Georgiev & Böker 2014). Often these NSCs co-exist with supermassive black holes (SMBH; e.g. Graham & Spitler 2009; Georgiev et al. 2016). The relationship between the mass of these central massive objects (CMOs) and the properties of their host galaxies is likely to be fundamental as it connects quantities that differ by several orders of magnitude (e.g. Ferrarese et al. 2006). It is still debated whether this relationship is physical through feedback from the SMBH on the host galaxy (e.g. Silk & Rees 1998), or statistical through many subsequent mergers of galaxies and their black holes (Jahnke & Macciò 2011). The answer might well come from the study of the formation and evolution of NSCs, which, unlike black holes, preserve their evolutionary history imprinted onto their stellar populations and kinematics.
Two main scenarios for NSC formation have been proposed. The first involves the dry merging of globular clusters (GCs) that migrated towards the centre of the galaxy as a consequence of dynamical friction (e.g. Tremaine et al. 1975). In the second scenario NSCs form in situ via dissipational sinking of gas onto the galactic nucleus and subsequent star formation (e.g. Mihos & Hernquist 1994). Various studies showed that it is difficult to reconcile unambiguously the proposed theoretical models with the plethora of observational phenomena that NSCs exhibit. For example, Turner et al. (2012) studied the photometric structural parameters of a large sample of NSCs in the Fornax and Virgo clusters and suggested that nuclei in high-mass early-type galaxies (ETGs) most likely grow through gas accretion triggered by wet mergers. At lower masses they suggested that the dominant mechanism is probably the infall and merging of star clusters with a possible hybrid population where both mechanisms work simultaneously. Spengler et al. (2017) investigated the structural parameters of nuclei in the Virgo cluster and found that the most massive host galaxies tend to have flatter nuclei, suggesting that they may be formed predominantly through dissipative processes that can induce flattening and rotation.
When looked at up close spectroscopically and with adaptive optics (AO), galactic nuclei display even larger variety: many NSCs contain multiple stellar populations and some are embedded in stellar or gaseous discs (e.g. Walcher et al. 2005; Rossa et al. 2006; Seth et al. 2006, 2008; Barth et al. 2009; Lyubenova et al. 2013). These complex properties have been explained with the help of numerical simulations involving both the merging of star clusters and gas dissipation (e.g. Hartmann et al. 2011; Guillard et al. 2016). However, Tsatsi et al. (2017) showed that pure globular cluster merging simulations (Antonini et al. 2012; Perets & Mastrobuono-Battisti 2014) provide a good explanation of the observed stellar kinematics substructures of the closest NSC, that in the Milky way (Feldmeier et al. 2014).
In Lyubenova et al. (2013) we showed that even though the NSC in an early-type galaxy can have |V|/σ < 1, detailed dynamical modelling revealed that a significant stellar angular momentum is still preserved in the nucleus. Our first orbit-based dynamical model of a NSC revealed that co- and counter-rotating orbits are simultaneously needed to reproduce the observed stellar kinematics of the nuclear region in FCC 277. This counter rotation is indicative of some merger event with orbital angular momentum opposite to the host galaxy.
The increasing amount of excellent quality AO assisted integral-field spectroscopic data allows us to look at galactic nuclei in a way that was earlier only possible for the large-scale structure of galaxies. Although photometrically regular, the 2D stellar kinematics maps of ETGs often exhibit complex structures, with mis-aligned and counter-rotating components (e.g. Krajnović et al. 2011). Based on their specific stellar angular momentum and ellipticity ETGs separate in two subgroups: slow and fast rotators (Emsellem et al. 2007, 2011). Slow-rotator ETGs are usually more massive and mildly triaxial, while fast rotators are less massive, fainter, and oblate axisymmetric in shape (Emsellem et al. 2011; Weijmans et al. 2014). Cosmological hydrodynamical simulations suggest that slow rotators may result from dry mergers within the red sequence and that fast rotators likely result from gas-rich mergers (Naab et al. 2014).
With the goal to shed further light on the formation paths of NSCs, in this paper we present our exploration of the nuclear angular momentum of ETGs hosting NSCs using a similar formalism that is typically used for the host galaxies. We present new observations of five more nuclei of ETGs in the Fornax cluster (see Table 1 for their basic properties). We derived their stellar kinematics and together with our earlier data for FCC 277, measured the specific stellar angular momentum λRe of the final sample of six NSCs. We compared these measurements with those of GCs in the Milky Way (Kamann et al. 2018) and with simulated dry merger remnants from Antonini et al. (2012) and Perets & Mastrobuono-Battisti (2014).
Basic properties of the 6 galaxies studied in this paper.
2. Observations and data reduction
2.1. Sample selection
In this paper we analysed the nuclear stellar kinematics of six ETGs in the Fornax cluster. Our pilot study of the nucleus of the galaxy FCC 277, presented in Lyubenova et al. (2013), made use of natural guide star assisted AO observations; therefore the main selection criteria for that study was the availability of a suitable bright star nearby the nucleus. We compiled our sample of five new targets based on two main selection criteria: the brightness of the NSCs and their contrast with respect to the main body of the galaxy, as derived by Turner et al. (2012). These criteria ensured the collection of high-quality laser guide star (LSG) AO assisted IFU data within reasonable amounts of observing time. In Table 1 we listed the basic properties of the selected host galaxies and in Table 2 some basic properties of the NSCs can be found.
Basic properties of our galactic nuclei and their λRe.
2.2. Observations
The observations were carried out in service mode between 21 October and 29 November 2013 with the VLT/SINFONI (programme ID 092.B-0892, PI M. Lyubenova). In order to determine the spatially resolved properties of the NSCs we used the AO system in LGS mode. Owing to the brightness and point-like nature of our NSCs, we used them as tip-tilt stars for the LGS system. The observing conditions were always very good, with clear sky and guide probe seeing < 0.8″. We obtained all observations using SINFONI’s K-band grating (1.95–2.45 μm), which gives a spectral resolution R ∼ 3500 (6.2 Å FWHM as measured on sky lines).
Our data cover the central 3″ × 3″ of each galaxy and have a spatial sampling of  . We observed the galaxies in observing blocks (OBs) consisting of OOSOOSOOS (O=Object, S=Sky) sequence where we spent 6 × 300 s on source and 3 × 300 s on sky. This is an optimal configuration for minimising near-infrared (near-IR) sky line residuals in SINFONI observations of extended sources. Each object exposure was dithered with respect to the previous exposures with
  to reject bad pixels. The sky pointings were offset to north and east of each galaxy nucleus with amplitudes of 110″ (FCC 47), 71″ (FCC 148), 60″ (FCC 170),
  (FCC 177), and 71″ (FCC 310).
FCC 170 is the brightest galaxy in our sample, therefore to reach the required depth of observations we needed two such OBs with a total on source time of 1 h. For FCC 47, FCC 148, FCC 177, and FCC 310 we used five OBs, configured in a similar manner. For these observations the total on source time was 2.5 h. In order to remove the absorption features originating in the Earth’s atmosphere, after each OB and at a similar airmass, we observed a B dwarf star to act as a telluric reference star. These kinds of hot stars are particularly suited because of their relative lack of intrinsic absorption lines, apart from the Brackett γ absorption line at 2.166 μm, and their continuum in the K band is well approximated by the Rayleigh-Jeans part of the black-body spectrum, associated with their effective temperature.
2.3. Data reduction
The data reduction of FCC 47, FCC 148, FCC 170, FCC 177, and FCC 310 was similar to the data reduction of FCC 277 presented in Lyubenova et al. (2013), however with a few exceptions. We used a newer ESO SINFONI pipeline version 2.5.2 to perform the basic data reduction and obtain sky-subtracted data cubes, as well as their corresponding telluric stars. Unlike FCC 277, we did not use the pipeline to combine the individual exposures within one OB because we noticed that the centres of the galaxy nuclei did not always fall on the same (x, y) coordinates along the wavelength direction of each data cube.
To analyse this issue we reconstructed images, consisting of the median flux in every 10–20 wavelength pixels (corresponding to 24.5–49 Å width) of each sky-subtracted data cube of one on-source exposure. We estimated the median luminosity weighted centre of each image and found that these are offset by typically 1–2 spatial pixels ( –
– ) in x and < 1 pixel (
 ) in y direction, the strongest offset being usually redwards of 2.2 μm. We note that these shifts are rather small and we could not identify their source during the previous data reduction steps. We speculate that these might be due to residuals from the applied differential atmospheric correction. We were able to notice these shifts in our data owing to their very good quality. Our observations were taken in excellent sky conditions and the use of the LGS fed AO allowed for a considerable Strehl ratio. As a result, our NSCs are resolved and we cannot simply neglect these shifts. Therefore we corrected for the shifts by shifting each monochromatic cube plane with respect to the centre of the first plane in each individual exposure sky-subtracted data cube using a bilinear interpolation method. After that we computed and applied an optimised telluric correction for each of these cubes. Finally, we combined the data cubes from all available exposures of a given object (30 cubes for each object, except FCC 170 which had 12) using a biweight mean and obtained estimates of the error spectra as the standard deviations of these.
Our data reach a minimum S/N ∼ 40 per spaxel at the effective radius of the NSCs in FCC 148, FCC 170, and FCC 177. In FCC 47 and FCC 310 the minimum S/N at these radii is ∼20. To derive reliable stellar kinematics with the method that we used (see Sect. 3) a minimum S/N ∼ 40 is needed. Therefore, we spatially binned our data to achieve this threshold also further out of the NSCs effective radii with the help of the Voronoi 2D binning method of Cappellari & Copin (2003).
2.4. Spatial resolution
The goal of our study is to measure the 2D stellar kinematics of the nuclear regions of galaxies hosting NSCs. Thus it is important to know how well we resolve their spatially extended properties. In Fig. 1 we show a comparison between the derived isophotal light profiles from the HST and SINFONI. The black points refer to the HST/ACS z-band imaging (Ferrarese et al. in prep.). The red points denote our SINFONI+AO K-band reconstructed images, and the vertical dashed lines indicate the effective radii of the hosted NSCs. The SINFONI profiles are in general less steep in the nuclear regions and we attribute this to the lower spatial resolution of the SINFONI data as compared to the ACS. We note, however, that the sizes of NSCs increase with wavelength (e.g. Georgiev & Böker 2014; Carson et al. 2015). This effect may well contribute to the increased width of the SINFONI profiles.
During the observing runs point-spread function (PSF) calibrator stars were not observed, thus we used a different method to assess the spatial resolution of our AO fed SINFONI data, which also takes into account the effect of the re-centring of the monochromatic planes of the data cubes, described in Sect. 2.3 1. We achieved this by convolving the ACS z-band images of each galaxy (using a Tiny Tim PSF; Krist 1995, ∼0.1″) with a given Gaussian PSF until it matched the light distribution in the reconstructed SINFONI images. The grey shaded areas in Fig. 1 illustrate the full width at half maximum (FWHM) of these so-called PSFs. We note that these are conservative upper limits owing to the increase of NSC sizes with wavelength mentioned above.
In majority of the galaxies (four out of six) the FWHM of our final spatial resolution is smaller than the effective radii of the hosted NSCs. In three cases, FCC 148, FCC 170, and FCC 310, the spatial resolution of SINFONI is very similar to the HST. Thus we conclude that we are able to spatially resolve the stellar kinematics of the NSCs in FCC 47, FCC 148, FCC 170, and FCC 310.
3. Stellar kinematics
In Fig. 2 we present the mean stellar velocity and velocity dispersion maps of the nuclei of our sample of galaxies. We extracted these using pPXF (Cappellari & Emsellem 2004), employing a library of seven template spectra of K and M giant stars, observed with the same instrumental set-up. This set of stars, although limited in number owing to the lack of a large and well-calibrated near-IR stellar spectral library with sufficient spectral resolution, is shown to give fully consistent results in measuring the first and second stellar kinematics moments (Lyubenova et al. 2008). We fitted the wavelength range 2.1–2.36 μm and masked the regions affected by strong near-IR sky lines (Rousselot et al. 2000). Additionally, we added a sixth order polynomial to the fit to compensate for template mismatch. We determined the best-fitting velocity and velocity dispersions, together with their uncertainties, as the bi-weighted mean and standard deviations of 100 Monte Carlo realisations. For consistency, we rederived the kinematics maps of FCC 277 binned to the same S/N ∼ 40 as the other galaxies.
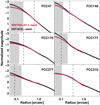 |
Fig. 1. Comparison between the light profiles of the galaxies in our sample from our ground-based plus AO imaging and space-based imaging. The red symbols denote our SINFONI+AO K-band reconstructed images; the black symbols indicate the HST/ACS z-band imaging. The light profiles were normalised in the region 0.5″ < Radius < 0.7″. The vertical dashed lines in each panel indicate the effective radius in z band of each NSC, as derived by Turner et al. (2012). The shaded area indicates the PSF FWHM of the SINFONI data. |
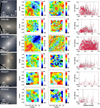 |
Fig. 2. Left panels: colour-composite HST/ACS images of the 6 galaxies in our sample. Middle panels: stellar mean velocity and velocity dispersion maps as derived from our SINFONI observations. Over-plotted are contours with constant surface brightness, as derived from our reconstructed K-band images. The white circles illustrate the effective radius of the NSCs based on the inner Sersić fits on HST z-band images (Turner et al. 2012). Right panels: |V|/σ radial distribution of the bins. The vertical dashed lines illustrate the effective radii of the NSCs in z-band. All maps and images are orientated such that north is up and east is to the left. |
Figure 2 reveals a great variety of stellar kinematics in the nuclear regions of NSC hosting galaxies in the Fornax cluster. On each map we indicated with a white oval the extent of the effective radius of the inner Sersić fit on HST z-band images of these galaxies (Turner et al. 2012). Our stellar kinematics maps are the sum of the NSC and the host galaxy kinematics. However, the NSCs light dominates the surface brightness profiles in the centres of nucleated galaxies (Côté et al. 2006; Turner et al. 2012). Therefore we can make a cautious assumption that the stellar kinematics that we observe inside the effective radii of the NSCs is representative of the NSCs themselves (but see the discussion in Sect. 4).
FCC 47 is the nearest galaxy in our sample and its NSC is most extended on the sky. The velocity map reveals a strong rotation (up to ±70 km s−1) inside the Reff of the NSC and a pronounced σ peak reaching ∼150 km s−1 in the centre, indicative of the presence of a SMBH.
FCC 148 shows a low level of rotation within the NSC’s effective radius. The maximum velocity of ±35 km s−1 is reached outside of the NSC and overlaps with flattened isophotes, which is indicative of the presence of a nuclear disc. Indeed, Turner et al. (2012) showed that the best fit to this galaxy’s light is obtained when a second large-scale disc component is added to the bulge and nucleus Sersić models. The velocity dispersion map has a peak of ∼70 km s−1 in the centre, which is less prominent than the peak in the nucleus of FCC 47.
FCC 170 hosts the most flattened NSC in our sample. The galaxy itself is viewed almost edge-on. The strong rotation in the central 2″ × 2″ reaches ±100 km s−1. The σ maps has a flattened drop in the centre.
FCC 177 does not show any ordered motions within the central 2″ × 2″ and the velocity dispersion map is flat.
The central kinematics of FCC 277 was studied in detail in Lyubenova et al. (2013). The maximum rotation of ±25 km s−1 is reached outside of the effective radius of the NSC and the velocity dispersion map has a distinct drop in the centre.
The stellar kinematics maps of FCC 310 is similar to FCC 177: no clear observed rotation and a flat sigma map with a tentative central drop.
The right-hand panels of Fig. 2 show the radial distribution of the ordered versus random motions (|V|/σ) inside our observed radii. The error bars reflect the excellent quality of our data, especially in the central areas occupied by the NSCs (indicated with vertical dashed lines). In all cases |V|/σ < 0.6 in the nuclear regions and are indicative of kinematically hot pressure supported systems. Traditionally, |V|/σ has been used to examine the dynamical state of ETGs (Davies et al. 1983). However, galaxies with very different mean velocity structures can have similar |V|/σ (Emsellem et al. 2007). Therefore, in order to explore the global velocity structure of galaxies using 2D spatial kinematics, the specific stellar angular momentum, λRe (Emsellem et al. 2007), is largely used. Moreover, this quantity is closer to the true angular momentum of the systems.
4. Specific angular momentum λRe
In order to quantify the observed projected stellar angular momentum in our sample of six galactic nuclei we measured the specific stellar angular momentum λRe following the standard equation (Emsellem et al. 2007)
 (1)
(1)
where Fi, Ri, Vi, and σi are the flux, circular radius, velocity, and velocity dispersion of the ith spatial bin and the sum runs on the Np bins. We used the stellar kinematics maps presented in Sect. 3. To define the extraction apertures we used the effective radius Reff, z of the inner Sersić fit on HST/ACS z-band images (Turner et al. 2012), describing the NSCs in our sample of galaxies. The ellipticity (ϵe) and position angle (PA) within that radius we estimated as the median ϵe and PA of the isophotes in the range  , based on the isophotal analysis of HST/ACS z-band images (Ferrarese et al., in prep.).
The ellipticities that we used might not be matching the true ellipticities of the NSCs. Turner et al. (2012) studied the 2D properties of galaxies and found that nuclei in brighter (and higher mass) galaxies are more flattened and may be more likely to contain edge-on disc-like components. However, they performed 2D surface brightness profile fitting only to galaxies with BT ≥ 13.5, and therefore FCC 47, FCC 170, and FCC 177 were excluded. FCC 148 and FCC 310 required multi-component nucleus fits and thus no clean measurement was possible. The only galaxy from our sample that has a 2D fit is FCC 277 and indeed the NSC measured ellipticity was 0.41, which is higher than the ellipticity measured over the galaxy plus NSC inside the same radius (see Table 2). Taking into account that our observed stellar kinematics maps are the sum of these two components and may be additionally including nuclear discs, we chose to define our extraction apertures based on the HST/ACS z-band total isophotal profiles. Even though the stellar light in these nuclear regions is dominated by the NSCs, we take a cautious assumption that our λRe values are representative of the galaxy nuclei, rather than of the NSCs only.
In Fig. 3 we plotted our measurements of the specific stellar angular momentum λRe inside the six nuclei in our sample versus their mean ellipticities, ϵe, inside the effective radii of their NSC. As a comparison sample we used Milky Way GCs (Kamann et al. 2018), with ellipticities are taken from Harris (1996, 2010 edition). This diagram is similar to the commonly used λRe − ϵe diagram to classify galaxies into slow- and fast-rotators (Emsellem et al. 2007, 2011; Falcón-Barroso et al. 2015; Cortese et al. 2016; Graham et al. 2018).
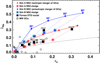 |
Fig. 3. Ellipticity vs. specific angular momentum λRe of the NSCs in the 6 Fornax cluster galaxies (filled squares, uncertainties are smaller than the symbols) are compared with GCs in the Milky Way (Kamann et al. 2018, open circles represent GCs for which the kinematics data do not reach the half-light radius and λRe is measured within the available maximum extent). The coloured symbols represent the values derived from the two simulated NSCs, described in Sect. 5; the dotted line connects measurements with the same viewing angle. The dashed line denotes the separation line between slow- and fast-rotating galaxies (Emsellem et al. 2011). |
Kamann et al. (2018) found that the amount of rotation of the studied GCs correlates with their ellipticities, in line with the findings of Bellazzini et al. (2012), Bianchini et al. (2013), Kacharov et al. (2014). The six galaxy nuclei in our sample follow these trends as well and all of them are above the division line between slow- and fast-rotators (Emsellem et al. 2011). Thus they could be classified as mini fast-rotators based on this classification scheme. If we assumed that the results of the cosmological hydrodynamical simulations for the formation of ETGs (e.g. Naab et al. 2014) were applicable to the formation of NSCs, then we would conclude that these six mini fast-rotator nuclei are the result of dissipative processes. This is consistent with the conclusions of, for example Turner et al. (2012) and Spengler et al. (2017), who argued that nuclei in high-mass host galaxies (such as those studied in our sample) grow through gas accretion triggered by wet mergers.
Our measurements of λRe of the nuclei cannot be, however, directly compared to λRe of GCs or galaxies because the NSCs are embedded in the bulges of their host galaxies, as discussed above. Even though at first approximation the nuclear regions are dominated by the light of the NSCs, we cannot neglect the kinematical contribution of the over-imposed bulge. Therefore, we used simulations of NSC formation to assess the contribution of the bulges to the observed nuclear λRe.
5. Comparison with simulated NSCs
The simulated NSCs used in this work for comparison are similar to the NSC in the Milky Way (total mass of ∼107 M⊙) and are described in detail in Antonini et al. (2012), Perets & Mastrobuono-Battisti (2014), Tsatsi et al. (2017). These are formed in N-body simulations of the consecutive infall and merging of GCs in a galactic centre, hosting a central SMBH (M• = 4 × 10⁶ M⊙) and embedded in a spherical and initially non-rotating nuclear bulge of mass 108 M⊙. With the merging of GCs, the bulge gains angular momentum, although at a much lower level than the NSC (see Fig. 1 of Tsatsi et al. 2017). The resulting effect on the stellar kinematics of the system NSC + bulge is that it has a lower net rotation as compared to the NSC only.
For our comparison, we used NSCs formed in two different dry merger scenarios: Simulation A concerns a NSC formed by GCs that in-spiral to the galactic centre from randomly chosen orbital directions, and in Simulation B the NSC is formed by GCs that share a similar orbital direction of in-spiralling. We adopted a range of viewing angles: 0°, 30°, 45°, 60°, and 90° with respect to the total angular momentum vector, so that 90° corresponds to the projection where the rotation of the NSC is maximum in our line of sight (LOS). We then created “SINFONI-like” LOS kinematic maps in each projection, in a field of view covering one half-mass radius of each cluster (∼10 pc) and a pixel size of 0.5 pc, from which we derived λRe and ϵe in a similar manner as in our Fornax nuclei described in Sect. 4.
Additionally, to understand how the galaxy host stars surrounding a NSC can contaminate its observed LOS kinematics, we re-estimated λRe and ϵe for the simulated NSCs accounting for contamination from stars of their surrounding nuclear bulge in each projection. The kinematics of the simulated NSCs used in this work are described in more detail in Tsatsi et al. (2017). They found that a NSC that has formed through the merging of GCs, can have a significant rotation; this fact has so far been attributed mainly to gas infall and is compatible to the observed properties of the Milky Way NSC (Feldmeier et al. 2014). In general, the measured λRe of the bulge+NSC system is a lower limit to the NSC λRe only. The exact suppressive effect of a typical slowly rotating bugle (e.g. Emsellem et al. 2011; Falcón-Barroso et al. 2017) depends on various parameters, i.e. structural properties, the misalignment of NSC compared to its bulge, and the viewing angle.
The derived λRe and ϵe for the two simulated NSCs are shown in Fig. 3. The first notable observation is that all measurements of the simulated NSCs can be classified as fast-rotating. In general λRe increases with the viewing angle and when the measurement is decontaminated from the surrounding nuclear bulge. Thus, we can conclude that the measured λRe inside the nuclei of the six Fornax galaxies are lower limits to the specific angular momentum of their NSCs, under the assumption that their main contamination is by a slow-rotating component, such as a bulge. The observational fact that we see some of the NSCs embedded in rotating discs (i.e. FCC 148, FCC 170, and FCC 277) has little effect on the measured λRe inside the effective radii of the NSCs. This is because the light of the discs is extended, in contrast with the bulge and the NSC, which are both concentrated. As a result, the rotation of the disc contributes negligibly to the light-weighted measurement inside the effective radii of the NSC.
Second, the majority of the observed nuclei follow closely the predictions of Simulation A (red symbols), i.e. the case with isotropic GCs merging, and when we take into account the contamination by the nuclear bulge. The nucleus of FCC 47, which is the most spatially extended and with the best-resolved stellar kinematics available, overlaps with the contaminated Simulation B (blue symbols; GCs have fallen from a similar orbital direction). The detailed formation history of this NSC, including its stellar populations, are a subject of a forthcoming paper (Fahrion et al., in prep.). The λRe and ϵe of the nucleus of FCC 170 are inconsistent with the contaminated cases of any of the GC merger simulations. This is the most flattened nucleus in our sample and it is embedded in a metal-rich nuclear stellar disc, which in turn is embedded in a bulge (Pinna et al. 2019), indicating that a dissipative process might have played a significant role in its formation and growth (Guillard et al. 2016).
6. Concluding remarks
Nucleation is a wide spread phenomenon with galaxies of all types hosting NSCs. However, we still have not understood the mechanisms that govern their formation and growth. There are numerous studies that explore the photometric properties of NSCs. Spectroscopic data, however, are much more difficult to obtain because of the small spatial extents that these stellar systems have and the small contrast with respect to their hosts, especially in the case of ETGs.
In this paper we presented a new data set with integral-field spectroscopy of five nucleated galaxies in the Fornax cluster and included one more from our pilot study (Lyubenova et al. 2013). We studied the stellar kinematics of the six nuclei and compared this with a sample of Milky Way GCs and a suit of N-body simulations that form NSCs via the in-spiralling of GCs.
We found that all studied nuclei exhibit varied stellar kinematics. Four out of six exhibit clear rotation and one shows a peak in velocity dispersion in its centre, which is indicative for a SMBH. Another four nuclei display a velocity dispersion drop, including FCC 277, for which we presented an orbit-based dynamical model in our pilot study and found that a significant rotation on counter-rotating orbits is present.
When placed on the λRe − ϵe diagram the six nuclei behave similarly to Milky Way GCs. With the exception of one case, the remaining five nuclei are consistent with the λRe − ϵe of simulated NSCs (embedded in a contaminating nuclear bulge) that have formed via the merger of GCs. It has previously been suggested that the NSCs in higher mass galaxies, such as those studied in this paper (9.7 > log(Mdyn/M⊙) > 10.6), form via dissipative processes with hints that some might also involve the merger of GCs.
In this paper we showed that we cannot exclude the pure GC merging scenario as a viable path for the formation of NSCs. A caveat of our measurements is that they provide only lower limits to λRe of the NSCs because we cannot directly separate the observed kinematical contribution of the NSC and the surrounding bulge. A way forward would be to obtain dynamical decompositions based on orbit-based Schwarzschild models and use these as priors to perform photometric decomposition of the IFU data, as recently discussed in Zhu et al. (2018).
We note that telluric stars are not useful for this purpose as these calibration observations, as a rule, are taken without the AO system.
Acknowledgments
We are grateful to the ESO astronomers who obtained the data presented in this paper in service mode operations at La Silla Paranal Observatory. We acknowledge fruitful discussions with Alessandra Mastrobuono-Battisti, Glenn van de Ven, Harald Kuntschner, Monica Turner, Patrick Côté, Eric Peng, and Remco van den Bosch. We thank Laura Ferrarese for providing us with their results prior to publication. We also thank the referee for their valuable comments.
References
- Antonini, F., Capuzzo-Dolcetta, R., Mastrobuono-Battisti, A., & Merritt, D. 2012, ApJ, 750, 111 [NASA ADS] [CrossRef] [Google Scholar]
- Barth, A. J., Strigari, L. E., Bentz, M. C., Greene, J. E., & Ho, L. C. 2009, ApJ, 690, 1031 [NASA ADS] [CrossRef] [Google Scholar]
- Bellazzini, M., Bragaglia, A., Carretta, E., et al. 2012, A&A, 538, A18 [NASA ADS] [CrossRef] [EDP Sciences] [Google Scholar]
- Bianchini, P., Varri, A. L., Bertin, G., & Zocchi, A. 2013, ApJ, 772, 67 [NASA ADS] [CrossRef] [Google Scholar]
- Blakeslee, J. P., Jordán, A., Mei, S., et al. 2009, ApJ, 694, 556 [NASA ADS] [CrossRef] [Google Scholar]
- Böker, T., Laine, S., van der Marel, R. P., et al. 2002, AJ, 123, 1389 [NASA ADS] [CrossRef] [Google Scholar]
- Cappellari, M., & Copin, Y. 2003, MNRAS, 342, 345 [NASA ADS] [CrossRef] [Google Scholar]
- Cappellari, M., & Emsellem, E. 2004, PASP, 116, 138 [NASA ADS] [CrossRef] [Google Scholar]
- Cappellari, M., Bacon, R., Bureau, M., et al. 2006, MNRAS, 366, 1126 [NASA ADS] [CrossRef] [Google Scholar]
- Carson, D. J., Barth, A. J., Seth, A. C., et al. 2015, AJ, 149, 170 [NASA ADS] [CrossRef] [Google Scholar]
- Cortese, L., Fogarty, L. M. R., Bekki, K., et al. 2016, MNRAS, 463, 170 [NASA ADS] [CrossRef] [Google Scholar]
- Côté, P., Piatek, S., Ferrarese, L., et al. 2006, ApJS, 165, 57 [NASA ADS] [CrossRef] [MathSciNet] [Google Scholar]
- Davies, R. L., Efstathiou, G., Fall, S. M., Illingworth, G., & Schechter, P. L. 1983, ApJ, 266, 41 [NASA ADS] [CrossRef] [Google Scholar]
- den Brok, M., Peletier, R. F., Seth, A., et al. 2014, MNRAS, 445, 2385 [NASA ADS] [CrossRef] [Google Scholar]
- Emsellem, E., Cappellari, M., Krajnović, D., et al. 2007, MNRAS, 379, 401 [NASA ADS] [CrossRef] [Google Scholar]
- Emsellem, E., Cappellari, M., Krajnović, D., et al. 2011, MNRAS, 414, 888 [NASA ADS] [CrossRef] [Google Scholar]
- Falcón-Barroso, J., Lyubenova, M., & van de Ven, G. 2015, in Galaxy Masses as Constraints of Formation Models, eds. M. Cappellari, & S. Courteau, IAU Symp., 311, 78 [NASA ADS] [Google Scholar]
- Falcón-Barroso, J., Lyubenova, M., van de Ven, G., et al. 2017, A&A, 597, A48 [NASA ADS] [CrossRef] [EDP Sciences] [Google Scholar]
- Feldmeier, A., Neumayer, N., Seth, A., et al. 2014, A&A, 570, A2 [NASA ADS] [CrossRef] [EDP Sciences] [Google Scholar]
- Ferguson, H. C. 1989, AJ, 98, 367 [Google Scholar]
- Ferrarese, L., Côté, P., Dalla Bontà, E., et al. 2006, ApJ, 644, L21 [NASA ADS] [CrossRef] [Google Scholar]
- Georgiev, I. Y., & Böker, T. 2014, MNRAS, 441, 3570 [NASA ADS] [CrossRef] [Google Scholar]
- Georgiev, I. Y., Böker, T., Leigh, N., Lützgendorf, N., & Neumayer, N. 2016, MNRAS, 457, 2122 [Google Scholar]
- Graham, A. W., & Spitler, L. R. 2009, MNRAS, 397, 2148 [NASA ADS] [CrossRef] [Google Scholar]
- Graham, M. T., Cappellari, M., Li, H., et al. 2018, MNRAS, 477, 4711 [NASA ADS] [CrossRef] [Google Scholar]
- Guillard, N., Emsellem, E., & Renaud, F. 2016, MNRAS, 461, 3620 [NASA ADS] [CrossRef] [Google Scholar]
- Harris, W. E. 1996, AJ, 112, 1487 [NASA ADS] [CrossRef] [Google Scholar]
- Hartmann, M., Debattista, V. P., Seth, A., Cappellari, M., & Quinn, T. R. 2011, MNRAS, 418, 2697 [NASA ADS] [CrossRef] [Google Scholar]
- Jahnke, K., & Macciò, A. V. 2011, ApJ, 734, 92 [NASA ADS] [CrossRef] [Google Scholar]
- Kacharov, N., Bianchini, P., Koch, A., et al. 2014, A&A, 567, A69 [NASA ADS] [CrossRef] [EDP Sciences] [Google Scholar]
- Kamann, S., Husser, T.-O., Dreizler, S., et al. 2018, MNRAS, 473, 5591 [NASA ADS] [CrossRef] [Google Scholar]
- Krajnović, D., Emsellem, E., Cappellari, M., et al. 2011, MNRAS, 414, 2923 [NASA ADS] [CrossRef] [Google Scholar]
- Krist, J. 1995, in Astronomical Data Analysis Software and Systems IV, eds. R. A. Shaw, H. E. Payne, & J. J. E. Hayes, ASP Conf. Ser., 77, 349 [NASA ADS] [Google Scholar]
- Kuntschner, H. 2000, MNRAS, 315, 184 [NASA ADS] [CrossRef] [Google Scholar]
- Lyubenova, M., Kuntschner, H., & Silva, D. R. 2008, A&A, 485, 425 [NASA ADS] [CrossRef] [EDP Sciences] [Google Scholar]
- Lyubenova, M., van den Bosch, R. C. E., Côté, P., et al. 2013, MNRAS, 431, 3364 [NASA ADS] [CrossRef] [Google Scholar]
- Mihos, J. C., & Hernquist, L. 1994, ApJ, 437, L47 [NASA ADS] [CrossRef] [Google Scholar]
- Naab, T., Oser, L., Emsellem, E., et al. 2014, MNRAS, 444, 3357 [NASA ADS] [CrossRef] [Google Scholar]
- Neumayer, N., Walcher, C. J., Andersen, D., et al. 2011, MNRAS, 413, 1875 [NASA ADS] [CrossRef] [Google Scholar]
- Perets, H. B., & Mastrobuono-Battisti, A. 2014, ApJ, 784, L44 [NASA ADS] [CrossRef] [Google Scholar]
- Pinna, F., Falcón-Barroso, J., Martig, M., et al. 2019, A&A, 623, A19 [NASA ADS] [CrossRef] [EDP Sciences] [Google Scholar]
- Rossa, J., van der Marel, R. P., Böker, T., et al. 2006, AJ, 132, 1074 [NASA ADS] [CrossRef] [Google Scholar]
- Rousselot, P., Lidman, C., Cuby, J.-G., Moreels, G., & Monnet, G. 2000, A&A, 354, 1134 [NASA ADS] [Google Scholar]
- Seth, A. C., Dalcanton, J. J., Hodge, P. W., & Debattista, V. P. 2006, AJ, 132, 2539 [NASA ADS] [CrossRef] [Google Scholar]
- Seth, A. C., Blum, R. D., Bastian, N., Caldwell, N., & Debattista, V. P. 2008, ApJ, 687, 997 [NASA ADS] [CrossRef] [Google Scholar]
- Silk, J., & Rees, M. J. 1998, A&A, 331, L1 [NASA ADS] [Google Scholar]
- Spengler, C., Côté, P., Roediger, J., et al. 2017, ApJ, 849, 55 [NASA ADS] [CrossRef] [Google Scholar]
- Tremaine, S. D., Ostriker, J. P., & Spitzer, Jr., L. 1975, ApJ, 196, 407 [NASA ADS] [CrossRef] [Google Scholar]
- Tsatsi, A., Mastrobuono-Battisti, A., van de Ven, G., et al. 2017, MNRAS, 464, 3720 [NASA ADS] [CrossRef] [Google Scholar]
- Turner, M. L., Côté, P., Ferrarese, L., et al. 2012, ApJS, 203, 5 [NASA ADS] [CrossRef] [Google Scholar]
- Walcher, C. J., van der Marel, R. P., McLaughlin, D., et al. 2005, ApJ, 618, 237 [NASA ADS] [CrossRef] [Google Scholar]
- Wegner, G., Bernardi, M., Willmer, C. N. A., et al. 2003, AJ, 126, 2268 [NASA ADS] [CrossRef] [Google Scholar]
- Weijmans, A.-M., de Zeeuw, P. T., Emsellem, E., et al. 2014, MNRAS, 444, 3340 [NASA ADS] [CrossRef] [Google Scholar]
- Zhu, L., van de Ven, G., Méndez-Abreu, J., & Obreja, A. 2018, MNRAS, 479, 945 [Google Scholar]
All Tables
All Figures
|
Fig. 1. Comparison between the light profiles of the galaxies in our sample from our ground-based plus AO imaging and space-based imaging. The red symbols denote our SINFONI+AO K-band reconstructed images; the black symbols indicate the HST/ACS z-band imaging. The light profiles were normalised in the region 0.5″ < Radius < 0.7″. The vertical dashed lines in each panel indicate the effective radius in z band of each NSC, as derived by Turner et al. (2012). The shaded area indicates the PSF FWHM of the SINFONI data. |
| In the text | |
|
Fig. 2. Left panels: colour-composite HST/ACS images of the 6 galaxies in our sample. Middle panels: stellar mean velocity and velocity dispersion maps as derived from our SINFONI observations. Over-plotted are contours with constant surface brightness, as derived from our reconstructed K-band images. The white circles illustrate the effective radius of the NSCs based on the inner Sersić fits on HST z-band images (Turner et al. 2012). Right panels: |V|/σ radial distribution of the bins. The vertical dashed lines illustrate the effective radii of the NSCs in z-band. All maps and images are orientated such that north is up and east is to the left. |
| In the text | |
|
Fig. 3. Ellipticity vs. specific angular momentum λRe of the NSCs in the 6 Fornax cluster galaxies (filled squares, uncertainties are smaller than the symbols) are compared with GCs in the Milky Way (Kamann et al. 2018, open circles represent GCs for which the kinematics data do not reach the half-light radius and λRe is measured within the available maximum extent). The coloured symbols represent the values derived from the two simulated NSCs, described in Sect. 5; the dotted line connects measurements with the same viewing angle. The dashed line denotes the separation line between slow- and fast-rotating galaxies (Emsellem et al. 2011). |
| In the text | |
Current usage metrics show cumulative count of Article Views (full-text article views including HTML views, PDF and ePub downloads, according to the available data) and Abstracts Views on Vision4Press platform.
Data correspond to usage on the plateform after 2015. The current usage metrics is available 48-96 hours after online publication and is updated daily on week days.
Initial download of the metrics may take a while.