Fig. 1.
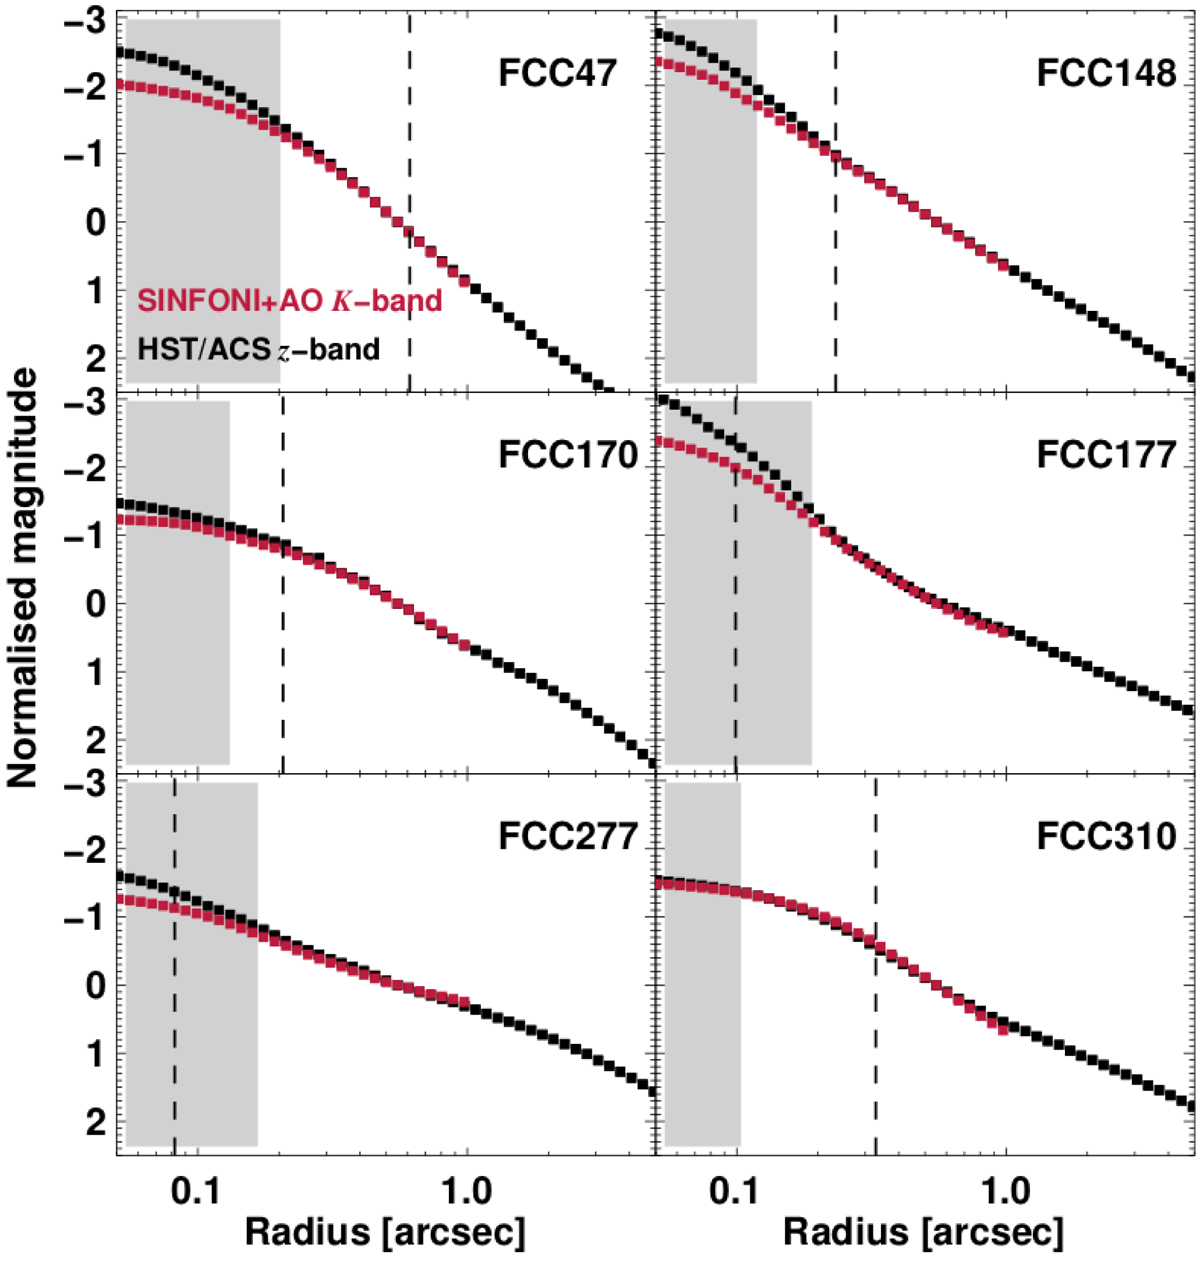
Comparison between the light profiles of the galaxies in our sample from our ground-based plus AO imaging and space-based imaging. The red symbols denote our SINFONI+AO K-band reconstructed images; the black symbols indicate the HST/ACS z-band imaging. The light profiles were normalised in the region 0.5″ < Radius < 0.7″. The vertical dashed lines in each panel indicate the effective radius in z band of each NSC, as derived by Turner et al. (2012). The shaded area indicates the PSF FWHM of the SINFONI data.
Current usage metrics show cumulative count of Article Views (full-text article views including HTML views, PDF and ePub downloads, according to the available data) and Abstracts Views on Vision4Press platform.
Data correspond to usage on the plateform after 2015. The current usage metrics is available 48-96 hours after online publication and is updated daily on week days.
Initial download of the metrics may take a while.