Fig. 2.
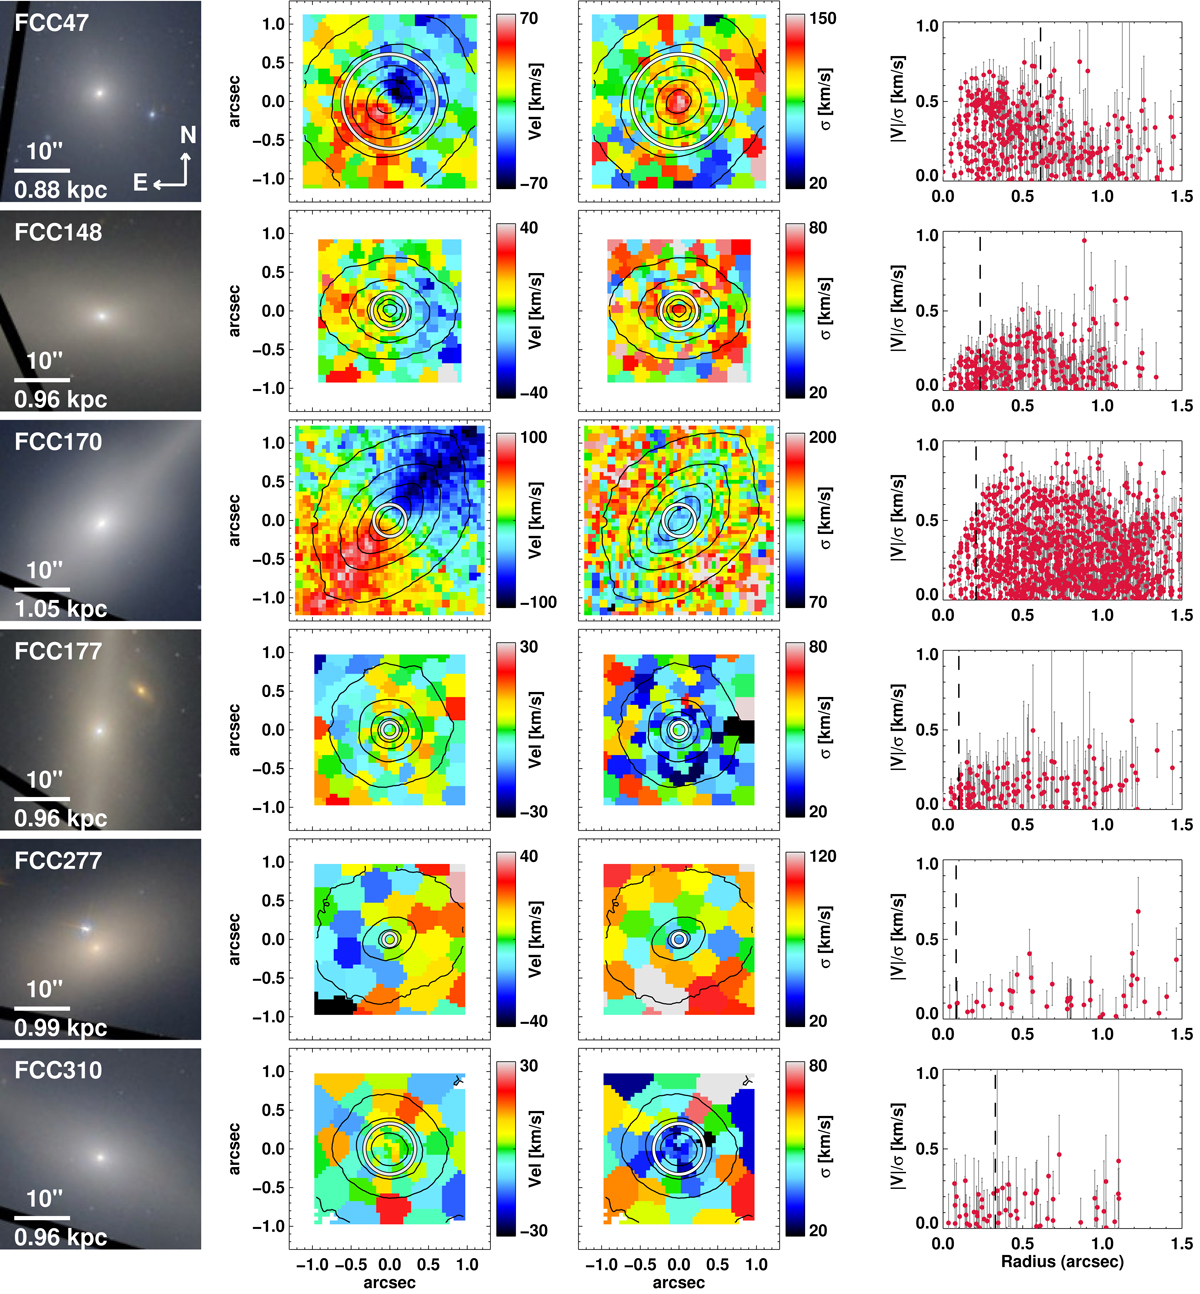
Left panels: colour-composite HST/ACS images of the 6 galaxies in our sample. Middle panels: stellar mean velocity and velocity dispersion maps as derived from our SINFONI observations. Over-plotted are contours with constant surface brightness, as derived from our reconstructed K-band images. The white circles illustrate the effective radius of the NSCs based on the inner Sersić fits on HST z-band images (Turner et al. 2012). Right panels: |V|/σ radial distribution of the bins. The vertical dashed lines illustrate the effective radii of the NSCs in z-band. All maps and images are orientated such that north is up and east is to the left.
Current usage metrics show cumulative count of Article Views (full-text article views including HTML views, PDF and ePub downloads, according to the available data) and Abstracts Views on Vision4Press platform.
Data correspond to usage on the plateform after 2015. The current usage metrics is available 48-96 hours after online publication and is updated daily on week days.
Initial download of the metrics may take a while.